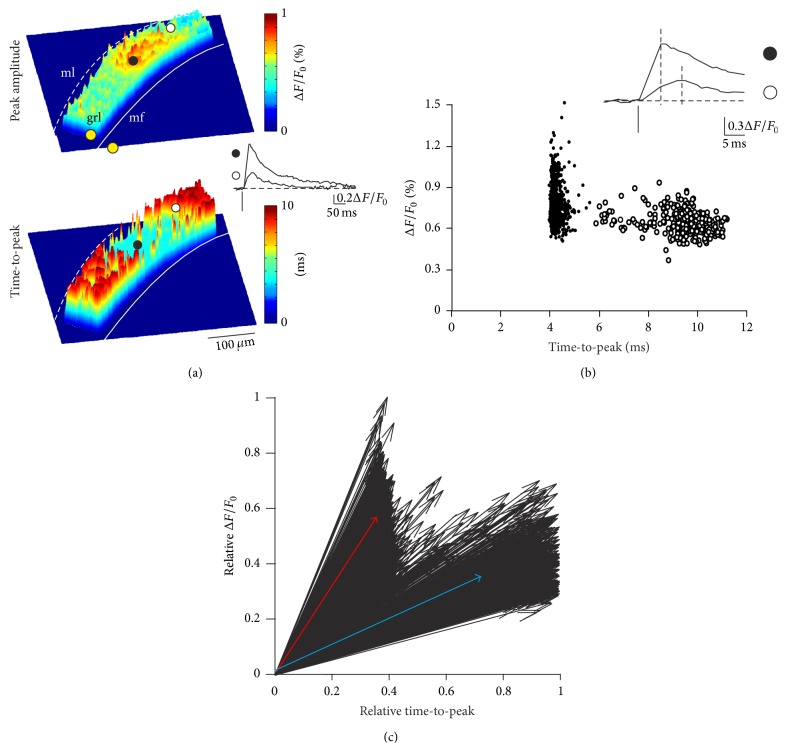
Figure 2.
Vector representation identifies two populations of VSD signals in the cerebellar granular layer. VSD imaging of granular layer activity in a rat parasagittal slice. In this and in the following figures mf = mossy fibers (continuous white line); grl = granular layer; ml = molecular layer; dashed white lines = Purkinje cell layer; yellow dots = stimulation electrodes. (a) Top. Activation map of the granular layer in response to a single pulse delivered to a mossy fiber bundle, in which pseudocolors represent response peak amplitudes. Bottom. Time-to-peak map for the same signals reported above (top). Traces illustrate time courses obtained from a region (filled circle) in which responses show large peak amplitude and short delay and a region (empty circle) with responses showing small peak amplitude and long delay. (b) The plot shows the Cartesian relationship between time-to-peak andpeak amplitude for the same experiment shown in (a). PCA analysis made it possible to distinguish between two groups of responses (filled and empty circles), which corresponded to the categories of signals observed in (a) and shown in the inset. (c) Signals shown in (b) were normalized for both peak amplitude and time-to-peak and represented as vectors. The thick blue vector results from averaging the empty circles in (b), while the thick red vector results from averaging the filled circles in (b).

