Figure 4.
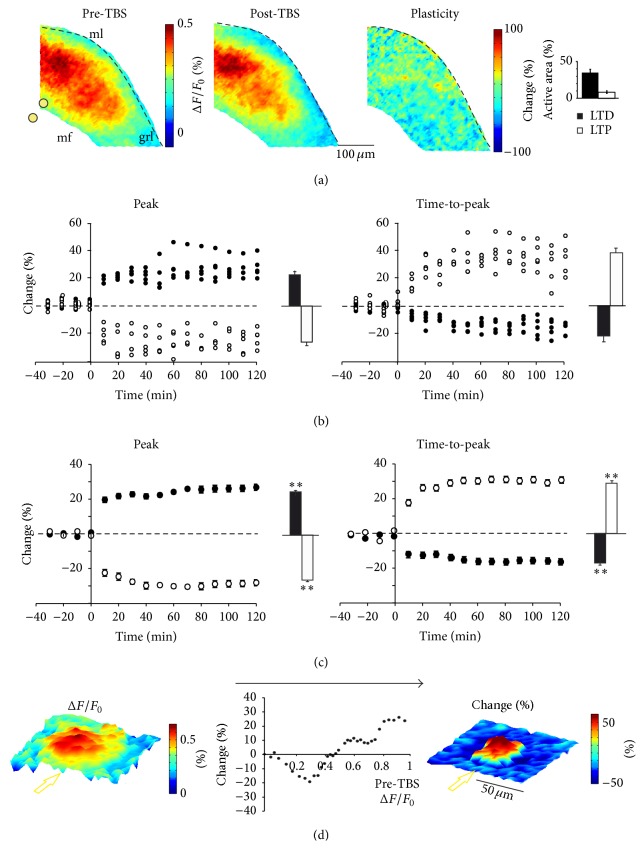
Properties of LTP and LTD. (a) Activation maps of the granular layer in response to a single pulse delivered to a mossy fiber bundle before (left) and after (middle) TBS. The distribution and intensity of the changes induced by TBS are shown in the subtraction map (right; see Section 2). The histogram shows the percentages of active pixels displaying LTP or LTD. (b) Time courses of VSD signal changes in five pixels showing LTP and five pixels showing LTD taken from the maps shown in (a). Pixels demonstrate stable responses in the control period and persistent variations of peak amplitude (left) and time-to-peak (right) after TBS. Note the inverse sign of the changes in the time course of peak amplitude and time-to-peak. The histograms show average changes in the 30–60 minutes after TBS compared to the control period. (c) Average time courses of all pixels showing LTP (n = 7 slices, n = 2603 pixels) and LTD (n = 8 slices, n = 10116 pixels) both for peak amplitude and time-to-peak. Histograms show average changes in the period 30–60 minutes after TBS compared to the control period. (d) Correspondence between theaverage center-surround map of VSD activation (left; n = 8 slices and 7056 pixels) and plasticity (right; n = 7 slices and 6174 pixels) (the maps were generated by centering over pixels showing maximal response or maximal LTP and realigning the slices along the mossy fiber bundle indicated by the yellow arrow; see Section 2). The plot (center) shows the relationship between excitation measured as initial VSD amplitude and relative changes following TBS (the data were obtained only from pixels displaying significant and persistent variations).

