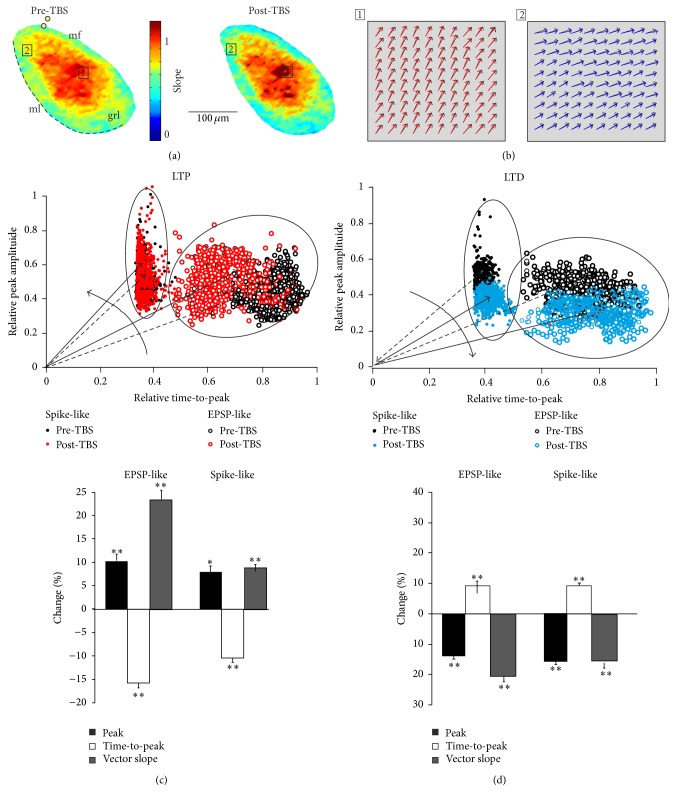
Figure 5.
Activation vectors allow mapping LTP and LTD. (a) Vector maps of the granular layer before (left) and after TBS (right). The colors represent the vector slopes. (b) Individual vectors of pixels showing LTP in a high-responding region (square 1) were obtained before and after TBS (black and red vectors, resp.). Similarly, individual vectors of pixels showing LTD in a low-responding region (square 2) were obtained before and after TBS (black and blue vectors, resp.). (c) Up. Activation vectors undergoing LTP are divided into two clusters based on PCA (spike-like, filled circles; EPSP-like, empty circles). LTP increases the average vector slope (from dashed to filled arrows). Down. Activation vectors undergoing LTD are divided into clusters based on PCA (spike-like, filled circles; EPSP-like, empty circles). LTD decreases the average vector slope (from dashed to filled arrows). (d) The histograms summarize the effects of LTP and LTD on peak amplitude, time-to-peak, and vector slopes in the EPSP-like and spike-like clusters (Student's t-test statistical significance: ∗ p < 0.05; ∗∗ p < 0.01).

