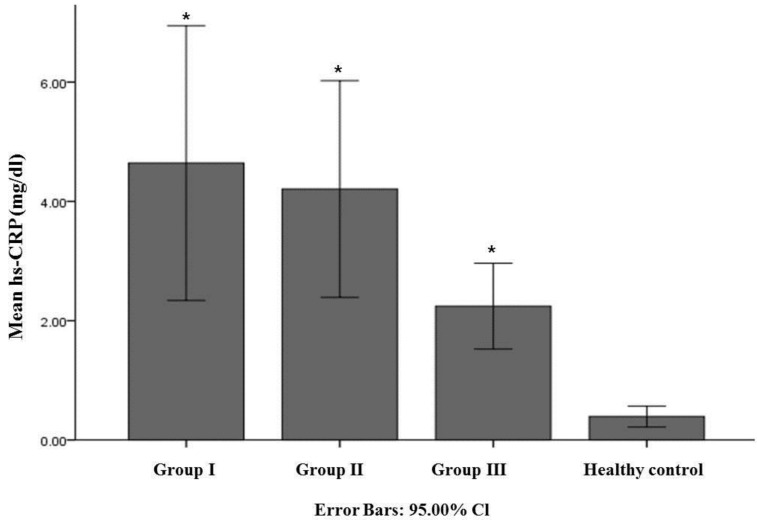
Figure 2.
Comparison of mean hs-CRP (mg/dl) among 3 AD subgroups. The bar graph with error bars presents the mean hs-CRP level associated with a 95% CI for the mean. The analysis of variance (ANOVA) with post-hoc tests, co-variance analysis for age and MMSE, compared mean serum hs-CRP levels in each of 3 AD subgroups and there was no significant difference in hs-CRP level among 3 AD subgroups. Group I, less than 70-year-old; Group II, 70-year-old to 79-year-old; Group III, more than 80-year. * P-value between group and healthy control <0.001.

