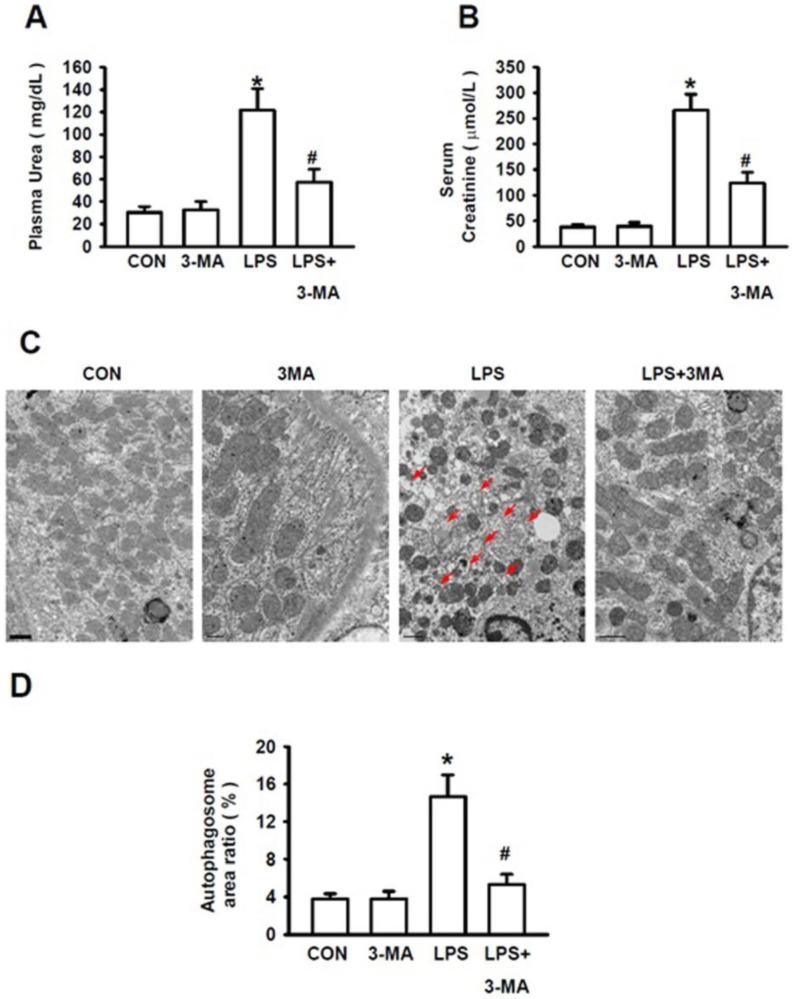
Figure 4.
Pharmacological inhibition of autophagy improved kidney injury. The mice were pretreated i.p. without or with or 3-MA at 15 mg/kg (in 0.1 mL of 0.9 % normal saline)(n=8) for 1h, followed by exposure to LPS (10 mg/kg in 0.1 mL of 0.9 % normal saline, n=8) for 24h. Blood samples were collected from mice in these groups. The levels of the serum creatinine and plasma urea were measured. A. Levels of plasma urea; B. Levels of serum creatinine; C. TEM visualization of the injury in renal cortex of mice, the red arrows point to autophygosomes; D. Quantitative analysis of the number per area of autophygosomes; *P<0.05 vs. CON; #P<0.05 vs. LPS.

