Fig 1.
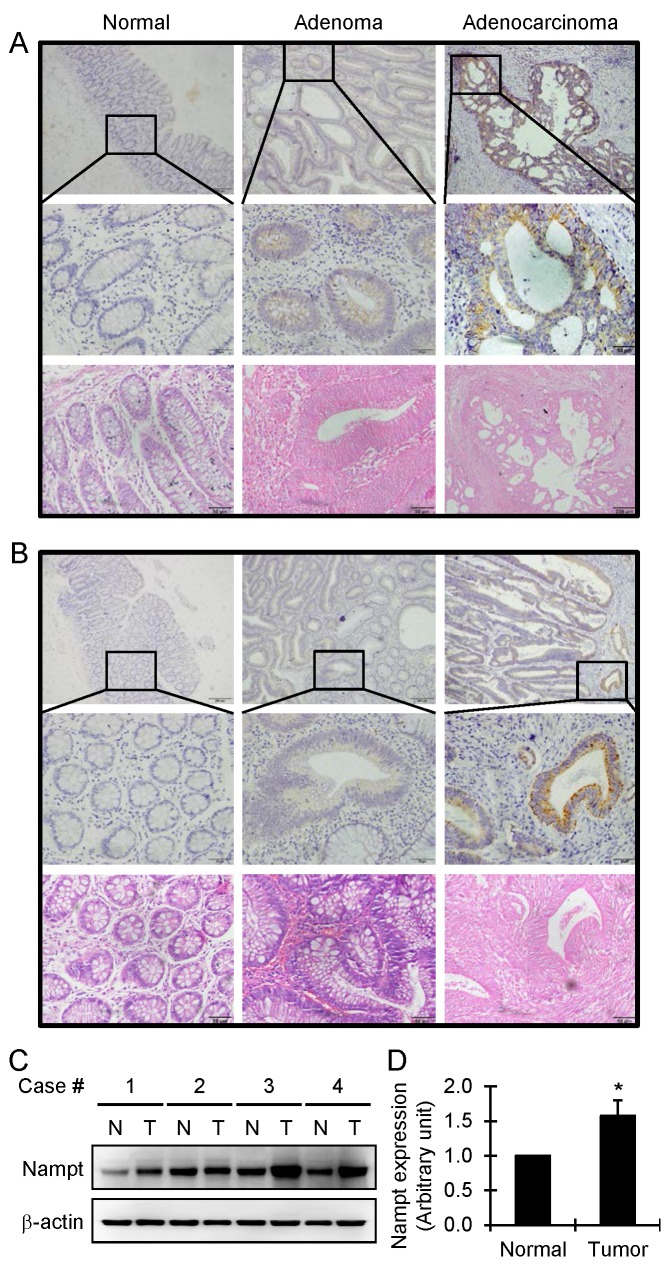
Detection of Nampt expression in the colorectal tissues by immunohistochemical staining. Representative images of Nampt expression in adjacent normal, adenoma, and adenocarcinoma tissues of colon (A) and rectum (B), respectively, are shown (top panel, original amplification ×100, scale bar 100 µm; middle panel, original amplification ×400, scale bar 50 µm; bottom panel, hematoxylin and eosin staining, original amplification ×400, scale bar 50 µm). A brown color in the cytoplasm is considered as a positive staining. The overexpression of Nampt in tumor tissues was further confirmed by Western blot (C). Nampt expression was increased in tumor tissues (T) compared with matched adjacent normal colorectal tissues (N) in four randomly selected patients and semiquantitatively analyzed after densitometry on the gels (D). Bar represents mean±SEM. *, P < 0.05.

