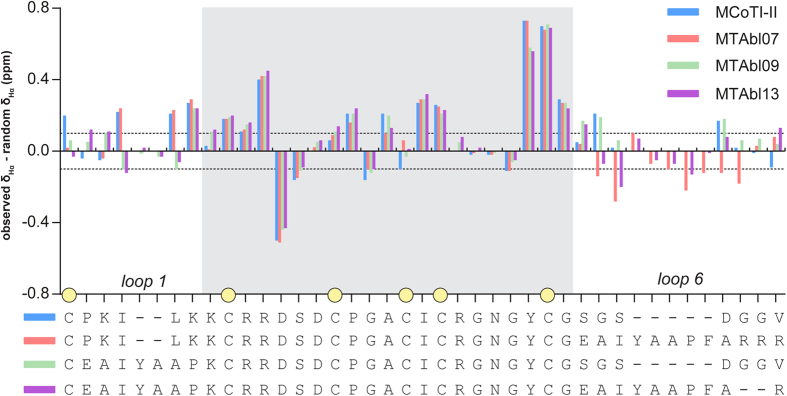
Figure 3. Secondary Hα chemical shift analysis of MCoTI-II and selected grafted analogs, MTAbl07, MTAbl09 and MTAbl13.

The color used for each peptide is shown in the key at the top right. The dotted lines represent secondary chemical shift values of −0.1 and 0.1 ppm. A sequence alignment of the four peptides is shown below the chart. Secondary Hα chemical shifts of the region with identical sequences are shaded in gray. Yellow circles mark the positions of cysteine residues.
