
Figure 1.
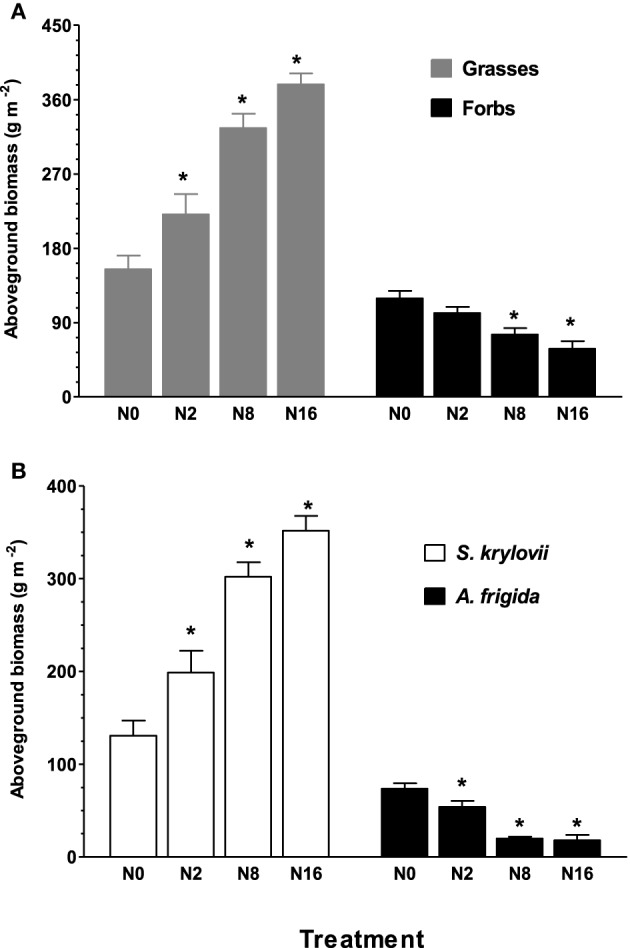
Effect of N addition on aboveground biomass of grasses and forbs (A), and S. krylovii and A. frigida (B). Aboveground biomass was determined in quadrats (1 × 1 m). N0, N2, N8, and N16 represent N addition rate of 0, 2, 8, 16 g ha−1 yr−1. Data are means ± s.e. (n = 8). Asterisks on the top of columns indicate significant difference at P < 0.05 between N0 and different rates of N addition for each species.