
Figure 3.
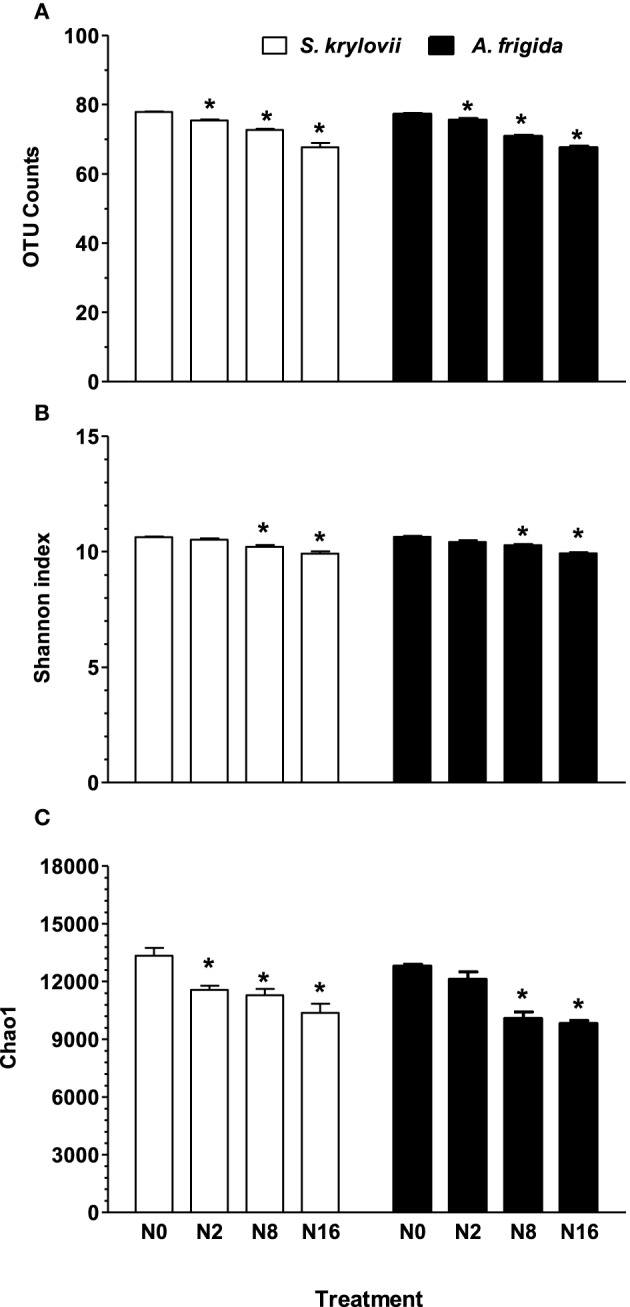
Estimated number of observed (A) OTU counts, (B) Shannon index, (C) Chao1 index of S. krylovii and A. frigida rhizosphere microbiome across all the N-supplied plots. Data are means ± s.e. (n = 3). Asterisks on the top of columns indicate significant difference at P < 0.05 between N0 and different rates of N addition for each species.