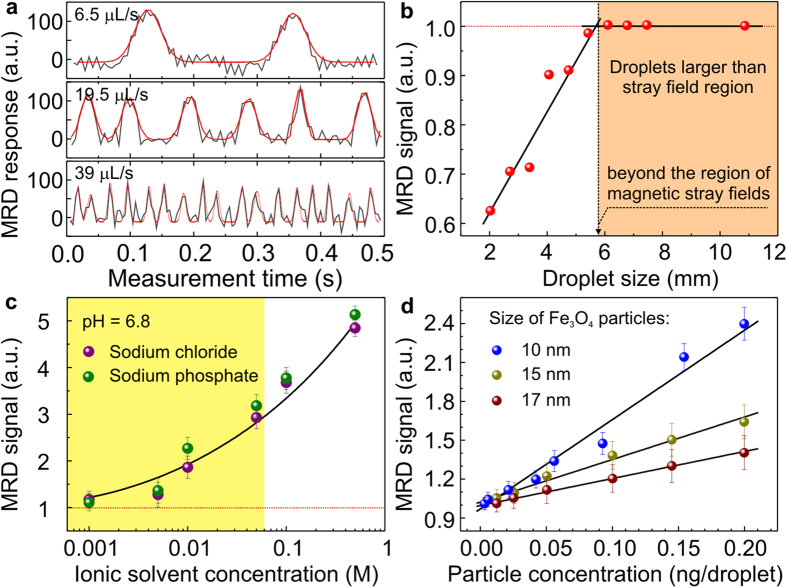
Figure 2.
(a) MRD response vs. time at different flow rates. Red solid lines in panel (a) is a Gaussian fit to the data, which was used to analyse the amplitude and full width at half maximum of the individual peaks. (b) MRD signal (=ratio between the amplitudes of the MRD response of the analyte and the adjacent reference droplet) vs. the droplet size. Orange region in (b) designates the droplet sizes, equal or larger than the region of the magnetic stray fields. (c) MRD signal as a function of the sodium chloride and sodium phosphate concentration. Region indicated in yellow in (c) corresponds to the physiological range (ionic strength, characteristic for the growth medium). (d) The measured MRD signal linearly increases with the concentration of magnetic nanoparticles. The effect of the particle sizes is shown as well.

