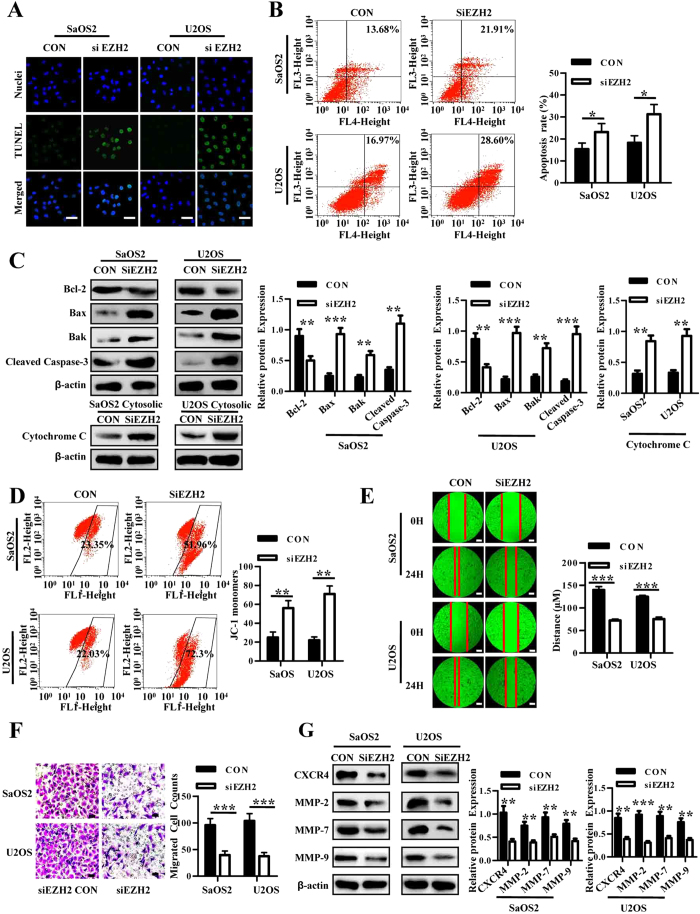
Figure 4. EZH2 silencing induces apoptosis and inhibits migration and invasion in osteosarcoma.
(A) Lenti-shEZH2 and control vector transfected SaOS2 and U2OS cells were immunostained with TUNEL antibody (green) and Hoechst33258 (blue); scale bars 50 μm. (B) Lenti-shEZH2 and control vector transfected cells were stained with Annexin V-APC and 7-AAD for flow cytometric analysis. Shown are representative images of three independent experiments. Bar graph (right) of flow cytometric analysis showing mean ± SD from three independent experiments is shown. *P < 0.05. (C) Western blot analysis of Bcl-2, Bax, Bak and cleaved caspase 3 proteins in SaOS2 and U2OS cells with or without EZH2 knockdown. Blots are representative of three experiments and were reprobed for β-actin to verify equal loading (right). Band intensities were measured by densitometry and normalised to β-actin expression. (D) Mitochondrial transmembrane potential assay. Osteosarcoma cells with or without EZH2 silencing were cultured under suspension and then stained with JC-1 solution for flow cytometric analysis. Shown are representative images of three independent experiments. Bar graph (right) of flow cytometric analysis showing mean ± SD from three independent experiments is shown. **P < 0.01. (E) Cell migration by wound healing assay in SaOS2 and U2OS cells. The photographs were taken at 0 h and 24 h, respectively. Y axis of bar graph of wound healing (right) is migration distance of tumor cells in 24 h. ***P < 0.001 bars, SD. Scale bars: 50 μm. (F) Trans-well migration assay using lenti-shEZH2 and control vector transfected SaOS2 and U2OS cells. The migrated cells were stained with crystal violet and counted. Bar graph of trans-well migration assay representing the mean value ± SD from independent experiments performed in triplicate. ***P < 0.001. Scale bars: 50 μm. (G) Western blot analysis of CXCR4, MMP-2, MMP-7 and MMP-9 proteins in osteosarcoma cells with or without EZH2 knockdown (left). Blots are representative of three experiments and were reprobed for β-actin to verify equal loading (right). Band intensities were measured by densitometry and normalised to β-actin expression.

