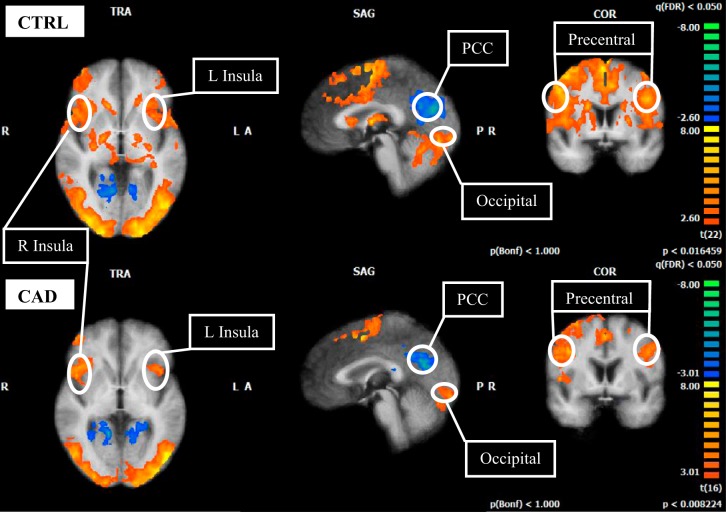
Fig. 2.
Cortical functional response to 40% IHG task in control (CTRL; top 3 images) and CAD (bottom 3 images). L, left; R, right; PCC, posterior cingulate cortex. T-statistics (beta values) at specified regions (circled) are represented as an average for each group. FDR, P < 0.05, corrected for multiple comparisons. Color scheme identified by scale at right. Red/warm colors denote regions of activation above baseline levels; blue/cold colors denote regions of deactivation below baseline levels (exact values given in beta graphs, Fig. 3). Note the absence of deactivation at the medial prefrontal cortex and hippocampus in both groups. TRA, transversal (axial); SAG, sagittal; COR, coronal; A, anterior; P, posterior.

