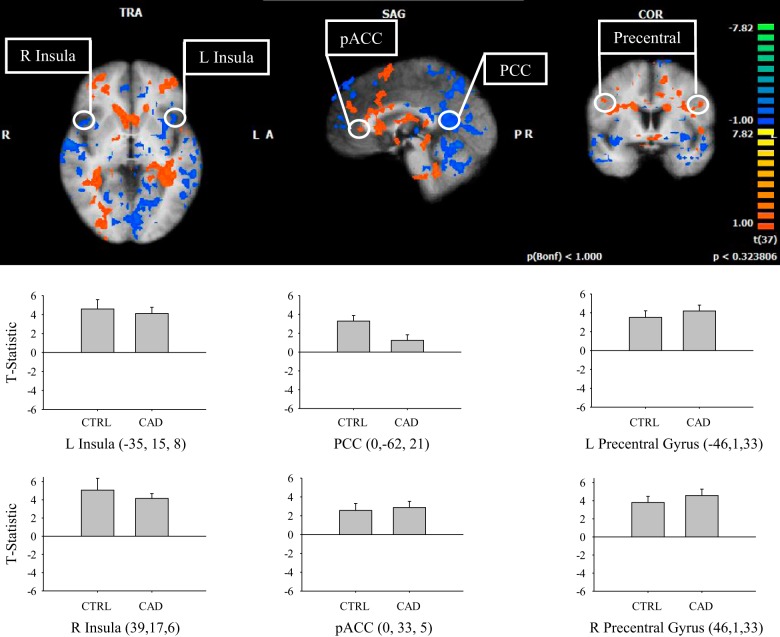
Fig. 5.
Subtraction result for group 1 average (CAD) vs. group 2 average (control) correlated to individual heart rate time course during 40% IHG task. L, left; R, right; PCC, posterior cingulate cortex; pACC, perigenual anterior cingulate cortex. Warm colors show areas where there is a positive difference with respect to group 1 (CAD > control), and cold colors show areas where there is a negative difference with respect to group 1 (CAD < control). T-statistic (beta value) at specified regions (Talairach coordinates, circled) are represented as an average for each group and denoted by color scale at right; threshold = 2. P < 0.05. Cluster threshold = 10 voxels. Error bars represent SD.

