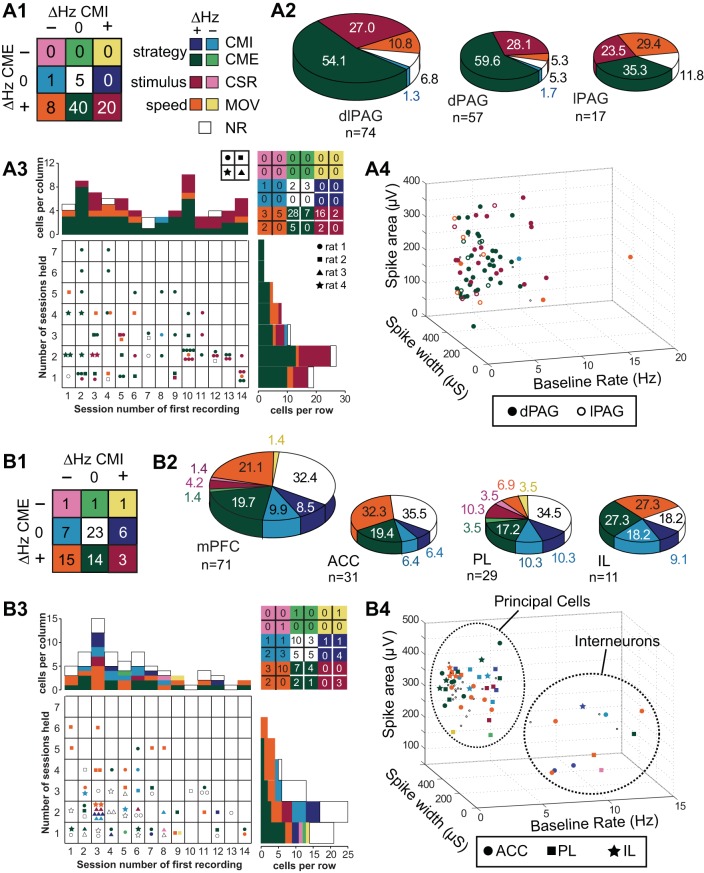
Fig. 3.
Cell type classifications in dlPAG (A) and mPFC (B). A1 and B1: summary table provides a color-coded key for the number of cells of each type; labels denote which cell types belong to the strategy-, stimulus-, and speed-selective categories. A2 and B2: large pie chart shows proportion of cells from each region that was classified in each type category; small pie charts show proportions of cell classifications by subregion. A3 and B3: table shows distribution of recording days across which cells were held (vertical axis) and of which session cells were first encountered in (horizontal axis, session 1 is the first session after 5 days of initial training); type category is indicated by symbol color, and rat is indicated by symbol shape (table at upper right summarizes total number of cells in each category by rat). A4 and B4: distributions of waveform parameters for all cells, with symbol shapes denoting which subregion the cell was recorded from (NR cells are plotted as small dots).

