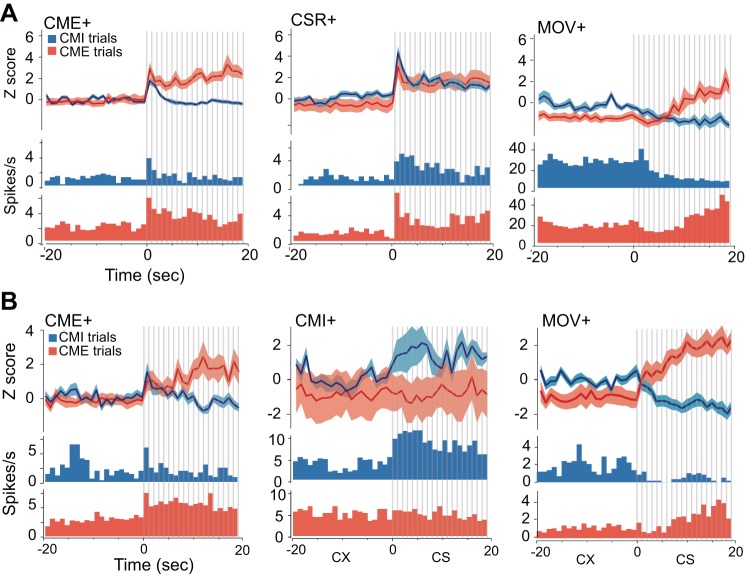
Fig. 4.
Dominant cell types in dlPAG and mPFC neurons. A: each panel shows population-averaged firing rates (top) and a peristimulus time histogram (PSTH) for 1 example cell (bottom) for the 3 most prevalent cell types recorded in dlPAG: CME+ cells (n = 40), CSR+ cells (n = 20), and MOV+ cells (n = 8). B: population-averaged firing rates (top) and a PSTH for 1 example cell (bottom) for 3 prevalent cell types recorded in mPFC: CME+ cells (n = 14), CMI+ cells (n = 6), and MOV+ cells (n = 15). For all graphs, bin size is 1 s, and vertical gray bars indicate individual CS pips.

