
Fig. 6.
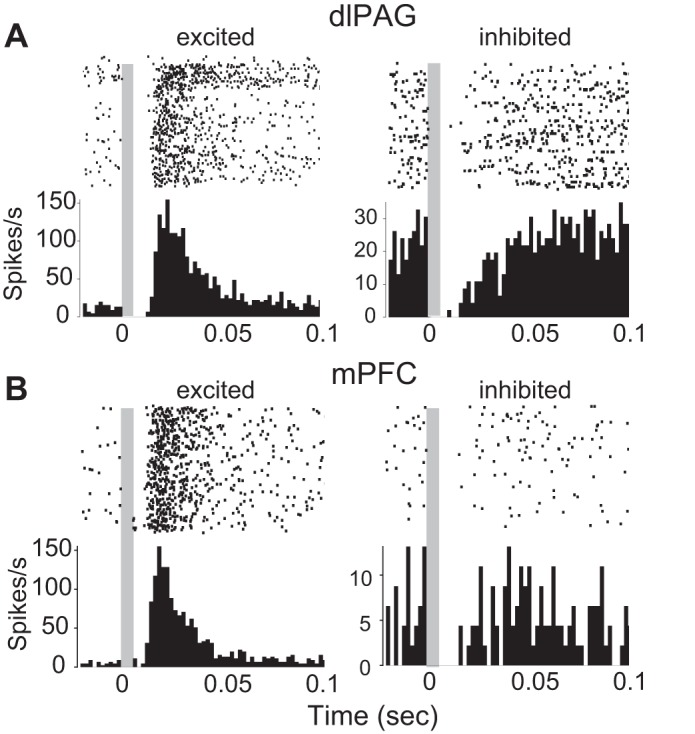
Shock-evoked responses of dlPAG and mPFC neurons. A: spike rasters and PSTHs for 2 example cells recorded in dlPAG that were excited (left) and inhibited (right) by shock pulses; t = 0 marks onset of the 2-ms shock pulse, and gray shading indicates the ∼6-ms time window during which spike recording was occluded by stimulus artifact (see materials and methods). B: same as A except data are shown for 2 example cells recorded in mPFC.