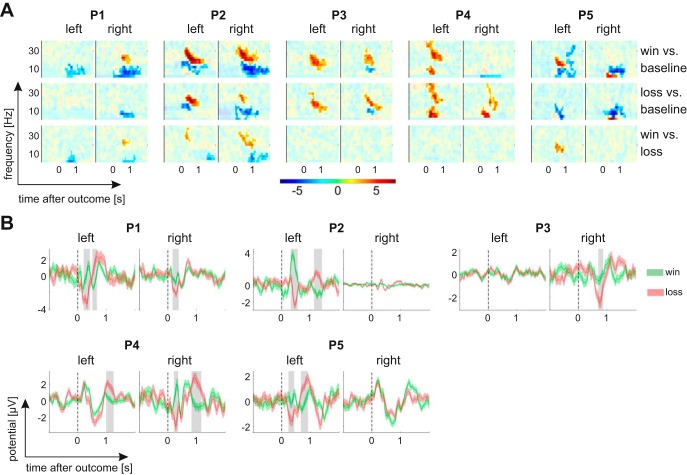
Fig. 3.
Outcome valence effects on time-frequency responses and evoked potentials. A: outcome valence effects on time-frequency responses up to 40 Hz (see methods for details). Color codes for t-values (gamble gains vs. gamble losses). Opaque areas are P ≥ 0.05. There is a consistent, significant increase in the power of beta oscillations within the first second after outcome onset, which is greater for gains than losses in three subjects. B: gain-evoked responses (green) have a greater (more positive) amplitude than loss-evoked responses (red) within the first few hundred milliseconds after outcome onset. In 4 of the 5 patients, there is also a later reversal of this effect. Shaded areas indicate significant (P < 0.05) time windows.

