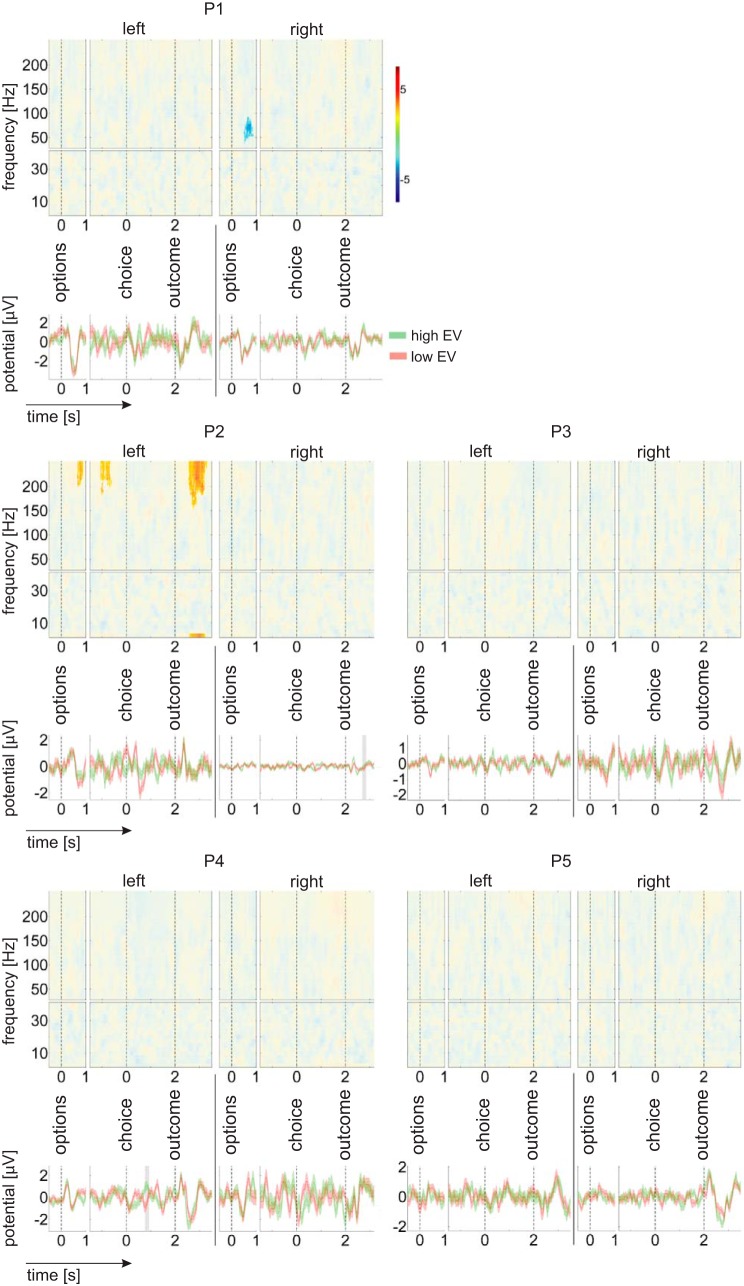
Fig. 4.
Expected value effects on time-frequency responses and evoked potentials. In the time-frequency plots, color codes for a regression t-statistic. Opaque areas are P ≥ 0.05. In the time-domain plots, the red and green time courses represent averages across trials with a relatively low or high expected value of the gamble option, respectively (as determined by a median split). Shading in the time-domain plots indicates significant (P < 0.05) time windows. In both time-frequency and time-domain plots, the perioption time window (at left, for each patient and hemisphere) includes all trials (irrespective of whether the gamble option or the safe option was chosen). The periresponse and perioutcome plots (at right, for each patient and hemisphere) includes only those trials in which a gamble option was chosen. Three patients show significant preoutcome expected value signals, but these signals vary in frequency and latency. Only a single patient (P2) shows an expected value signal after outcome onset, and that signal is not consistent with an expected value component of a unified RPE signal (see results). Note that raw LFP data were band-stop filtered to remove line noise (48.5 to 51.5 Hz and harmonics up to 250 Hz).

