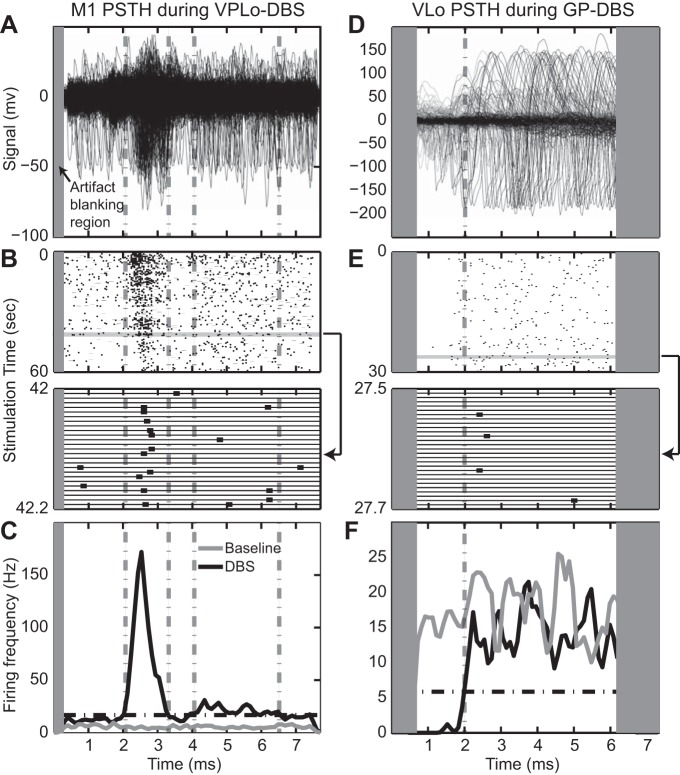
Fig. 2.
Examples of phase-locked spike activity to high-frequency stimulation. Overlap of stimulus-triggered spike activity in an M1 cell during VPLo DBS (A) and VLo cell during GP DBS (D). Time zero on the x-axis coincides with delivery of each stimulus pulse. Gray rectangle represents the region of the interpulse interval blanked by the stimulation artifact template subtraction algorithm. B and E: corresponding raster for the entire interpulse interval (top) and for a 0.2-s subsection. Bottom: 2 cells are present in the recording; only the larger responded to DBS and was used to generate the spike rasters and peri-stimulus time histogram (PSTH) plots. C and F: PSTH of the entire recording, showing significance level (black dot-dash line) and phases of significant excitation or inhibition (gray dot-dash lines). Note that the PSTH bin width was 0.1 ms, and the spike frequency in the example PSTHs reflects this bin width.

