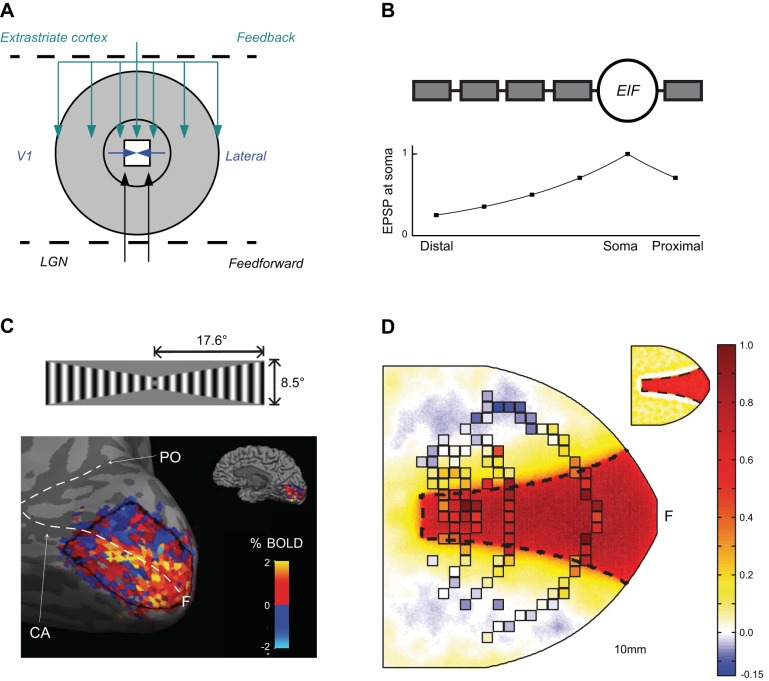
Fig. 7.
Simulating the BOLD response in the primary visual cortex. A: the network architecture of the model is adapted from Schwabe et al. (2006): The spatially limited extent of minimal receptive field provided by feedforward inputs is complemented by the lateral connections on V1 and modulatory feedback (with large receptive fields) from the extrastriate cortex. B: the modulatory role of the extrastriate feedback was implemented through connecting the feedback to distal dendrites, where the individual inputs were ineffective in driving the firing of the cells. C: BOLD SE response in V1 of a representative subject. The corresponding signal changes in individual voxels were mapped without threshold into the model cortical space through separate multifocal localizer run (Vanni et al. 2005) and downsampled to a 2 × 2 mm grid (D). The cerebral blood flow response estimate derived from the population mean BOLD data (squared samples), superimposed as discrete samples on the glutamate-mediated conductance response of the spiking neuron model to the same stimulus, which is presented as continuous data in the main panel. The spike response of the model is shown in the inset. It was to a large extent confined to the primary retinotopic representation of the stimulus on the model cortex (depicted by dashed border in D) with narrow surrounding reduction from the baseline firing rate (arrows). The letter F in C and D indicates the approximate region of foveal representation. LGN, lateral geniculate nucleus; EIF, exponential integrate and fire; EPSP, excitatory postsynaptic potential; PO, parietooccipital sulcus; CA, calcarine sulcus. Modified from Heikkinen et al. 2015.

