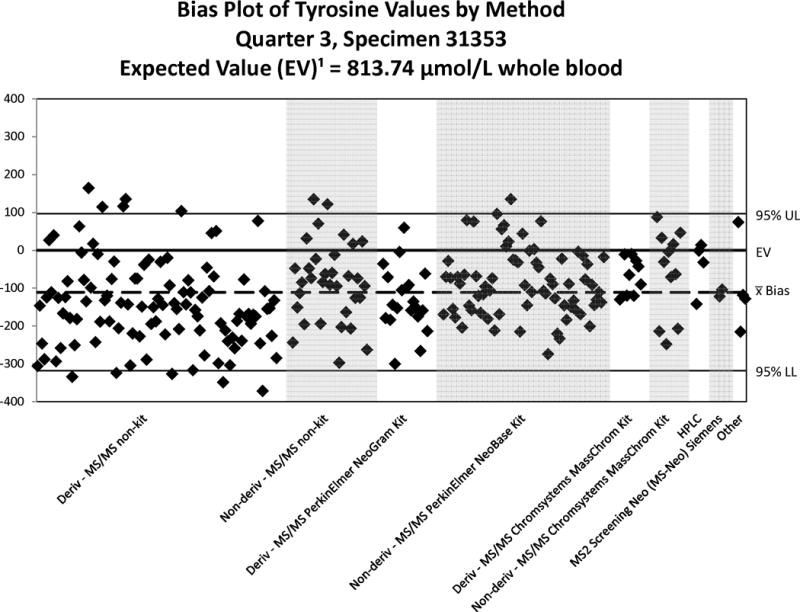
Figure 3.

Bias Plot of Tyrosine Values Reported by Domestic Laboratories – 2013. Note the scale-changes of the Y-axis relative to the expected value for each plot. A reported value matching the expected value will show the illustrated value as falling on the “0” line of the plot. A reasonable bias is less than ± 20% of the expected value or within the 95% confidence interval (CI). “Deriv” refers to BE derivatization. “Deriv” refers to BE derivatization; “Non-deriv” refers to FA analysis.
