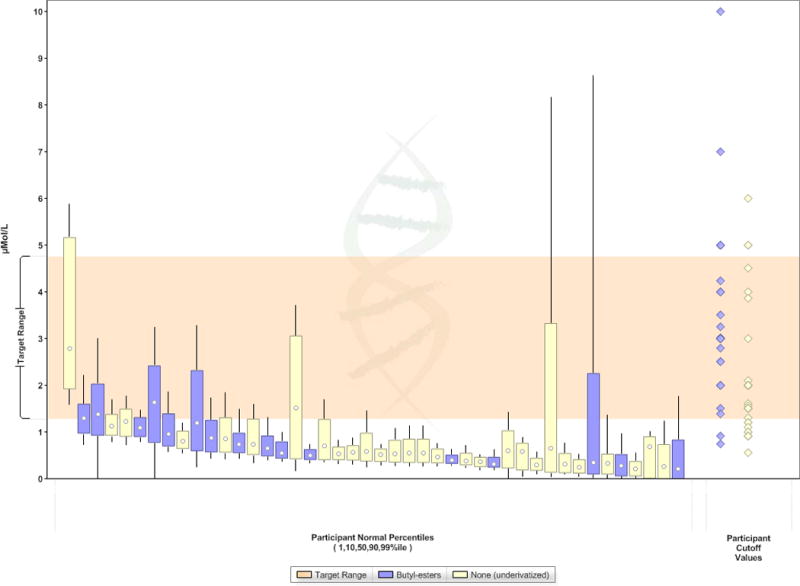
Figure 5.

Control ranges for SUAC of different NBS programs using butyl ester derivatization (BE) or not (FA) during sample preparation for measurement of acylcarnitines, amino acids and SUAC. Data are from the Region 4 MS/MS Collaborative Project and sorted by each participant’s 10th percentile value for SUAC. (The target range shown is defined as the interval between the cumulative 99th percentile of SUAC in normal populations and the lowest 5th percentile of SUAC observed in TYR I cases [28].)
