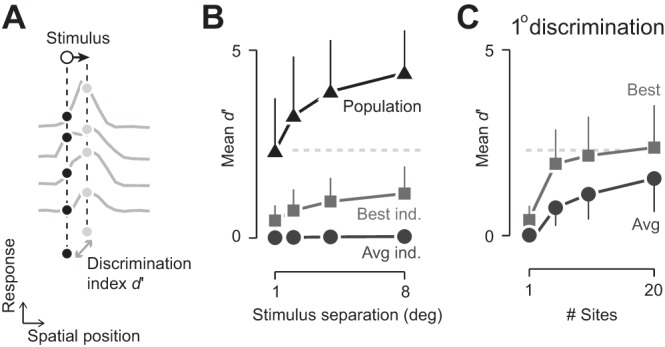
Fig. 2.

Area MT population response allows fine spatial discriminations along the trajectory of motion. A: schematic representation of the decoding task. Neural response at each electrode was binned according to stimulus position. For each pair of stimulus positions along a single trajectory, the d-prime (d′) discrimination performance was calculated. B: population response supports fine spatial discriminations; discrimination performance along the same trajectory. Triangles and line show performance with the full population (24–65 sites, depending on experiment). Circles and line show the average performance of individual recording sites (Avg ind.). Squares and line show performance of the optimal individual recording site for each spatial discrimination (Best ind.). Data were pooled across all experiments and all well-represented stimulus positions (n = 316, 308, 301, and 282 pairs, respectively, for 1°, 2°, 4°, and 8° spatial separation). Error bars represent 1 SD and for clarity, are shown on 1 side. Gray, dashed line shows average population performance for 1° spatial separation, extended to C. C: dependence of performance on population size. Each line shows performance for discrimination of 1° spatial separation. In each case, 80 randomly selected subpopulations (n = 5, 10, or 20) of responsive sites were analyzed and then collapsed across experiments. Circles and line show average performance across all randomly selected subpopulations. Squares and line show the best performing subpopulation. Conventions are the same as B.
