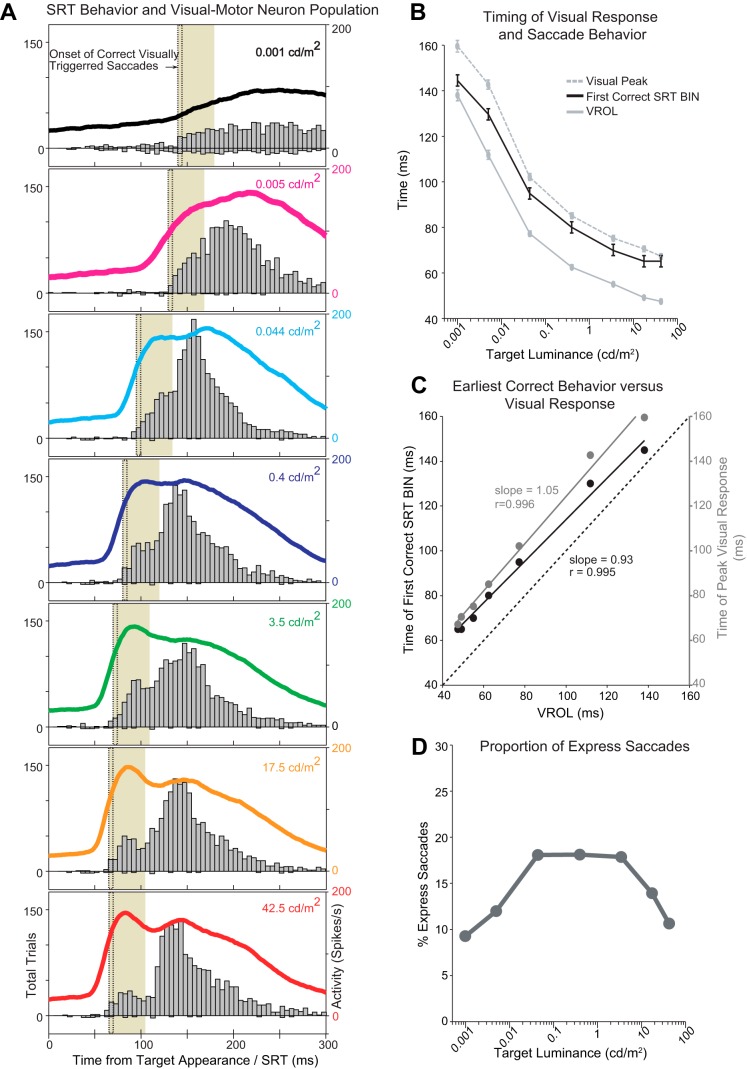
Fig. 3.
Effects of target luminance on express saccades and SC responses in the gap task. A: relationship between express saccades and visual response latencies. Grey bars denote a histogram of SRTs for correct saccades (above the zero line) and direction error saccades (below the zero line) in the gap task across 7 different luminance levels (column is organized from top to bottom in ascending luminance). The colored lines denote the population activity of 63 visual-motor (VM) neurons at each target luminance level in the gap task. Population spike densities (Poisson kernel) are aligned on target appearance and include all correct trials (luminance-specific visually triggered latencies) toward their optimal location. Dotted lines denote earliest SRT bin where saccades are visually triggered. Shaded SRT bins denote express saccade epoch derived from a combination of visual response timing and earliest visually triggered SRT (see methods). B: temporal modulation of visual response properties (time of visual response onset latency and peak) and the earliest visually triggered saccade latency (first histogram bin when saccade performance exceeds chance). The onset and peak of the visual response are denoted by solid and dotted grey lines, respectively. The time of the first correct SRT bin is denoted by a solid black line. C: linear correlations between VROL and the peak time of the visual response (gray data points and line) and VROL and the earliest SRT response time (black data points and line). D: mean proportion of express saccades across monkeys 1 and 2 determined by the timing of the visual response properties and earliest visually triggered SRT latencies.

