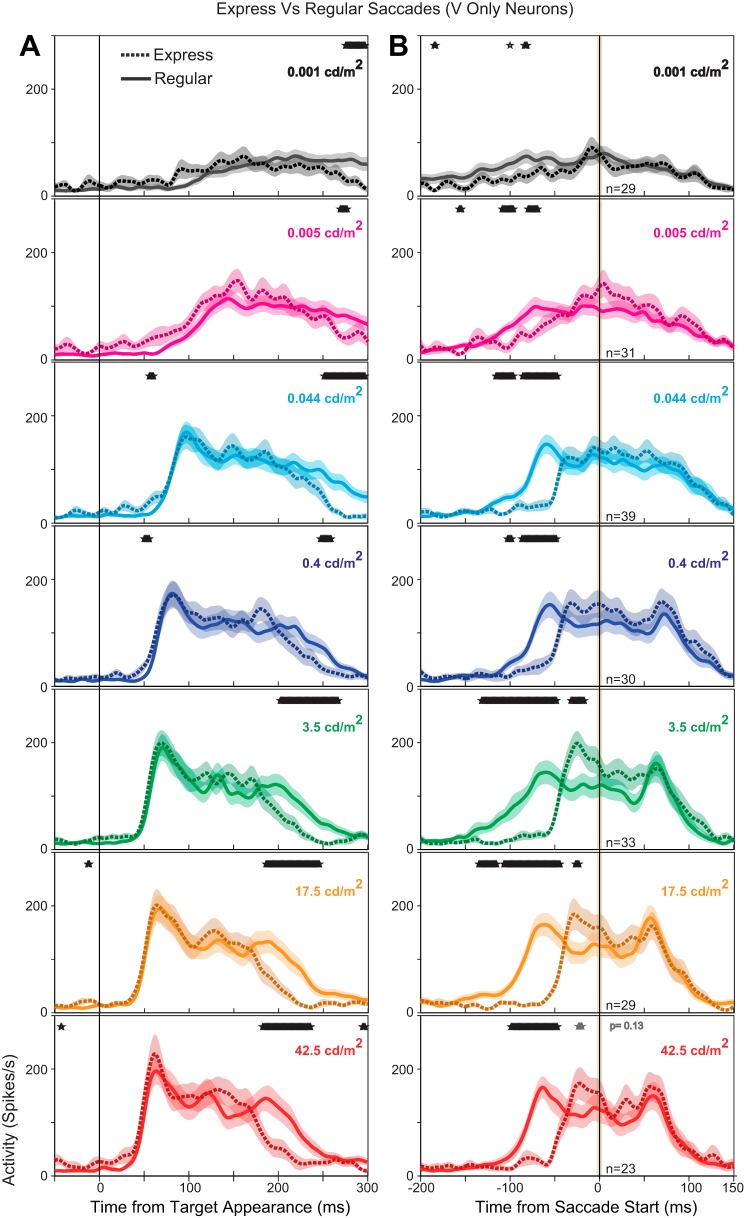
Fig. 4.
Neural population spike density functions (Gaussian kernel σ = 5 ms) comparing regular (solid line) and express saccades (dotted lines) for all visual-only neurons (VONLY). Population spike densities are aligned on target appearance (A) and saccade onset (B) and include all correct trials toward their optimal location in the gap task. Express saccades were separated based on luminance specific ranges (see methods). Colored lines denote the population response at each target luminance level (red: 42.5 cd/m2; orange: 17.5 cd/m2; green: 3.5 cd/m2; dark blue; 0.4 cd/m2; cyan: 0.044 cd/m2; pink: 0.005 cd/m2; black: 0.001 cd/m2). The width of the colored background shading denotes the means ± SE. Shaded vertical bars denote the time of the saccade (B). Overlapping black asterisks (A and B, top) denote times when the activity for express saccades and regular saccades were significantly different (5-ms window, t-test, P < 0.05).

