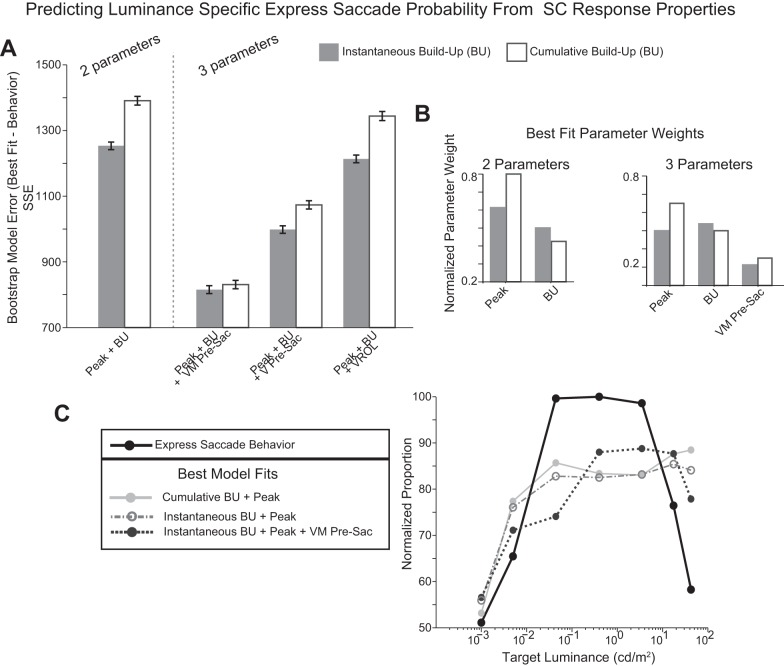
Fig. 7.
Model predicting express saccade likelihood from SC response parameters. A: sum of squares error (SSE) from best model fits to the mean proportion of express saccades produced across target luminance levels. Cumulative (white bars) and instantaneous (grey bars) buildup were calculated and modeled separately. Separate model fits were calculated from different combinations of neural parameters in the SC. Parameters modeled included the peak of the visual response (Peak), instantaneous buildup (BU), cumulative buildup (BU), and presaccadic (Pre-Sac) activity from VM- and V-only neurons. B: calculated parameter weights for the 2- and 3-parameter best fit models. C: best model fits to 2- and 3-parameter combinations of SC activity to the measured express saccade likelihood at each target luminance level: 1) cumulative buildup and peak visual response (light grey solid line), 2) instantaneous buildup and peak visual response (grey dash-dotted line), and 3) cumulative buildup, peak visual response, and presaccadic activity (dark grey dotted line).

