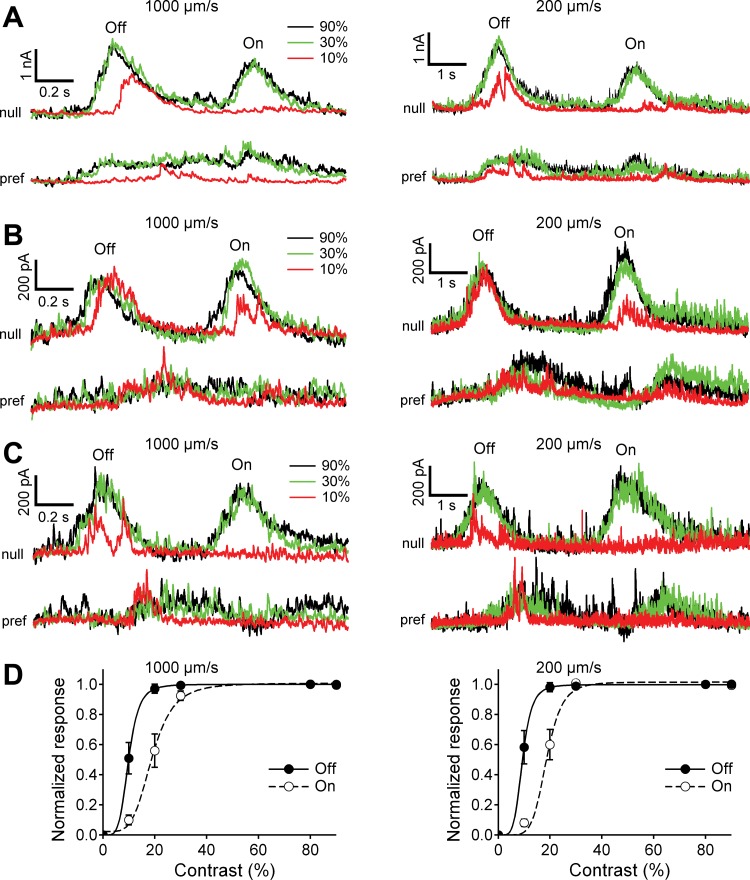
Fig. 12.
Inhibitory input to rabbit DSGCs is strongly nonlinear at high and low velocities. A–C: light-evoked inhibitory currents in 3 representative DSGCs in response to a narrow moving bar, 200 μm wide. For each cell, the inhibition is shown in response to motion in the null and preferred directions at high (1,000 μm/s, left) and low (200 μm/s, right) velocities and contrasts of 10%, 30%, and 90%. Note that the temporal scale on right is 5-fold larger than that on left. Although the integral of the inhibitory currents is larger for slower velocities (right), the peak currents are nearly the same. D: contrast dependence of the integrated On and Off inhibitory currents in response to a narrow bar moving in the null direction at 1,000 μm/s (left) and 200 μm/s (right); n = 24. The integrated currents were normalized and fit with the Hill equation (see materials and methods). Note that the nonlinearity of the integrated currents is underestimated because of the averaging over the duration of the response (e.g., in A, left, Off-inhibitory conductance at 10% contrast is 0 in the beginning and saturated at the end, whereas the integrated current is a time average and represents this as a submaximal inhibition).

