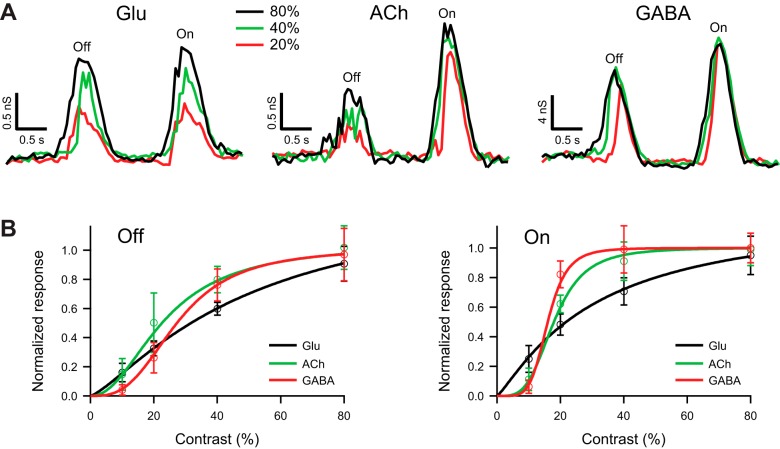
Fig. 6.
Glutamatergic input to guinea pig DSGCs increases gradually with contrast. A: light-evoked glutamatergic (left), cholinergic (center), and GABAergic (right) conductances in a representative DSGC in response to a narrow bar (100 μm), moving in the null direction at 400 μm/s, and contrasts 20%, 40%, and 80%. Glutamatergic and GABAergic conductances were measured under block of nicotinic receptors. The cholinergic conductance was measured as the difference between excitatory inputs in control and under block of nicotinic receptors. B: contrast dependence of the integrated Off (left) and On (right) glutamatergic, cholinergic, and GABAergic conductances in response to a narrow bar (100 μm) moving in the null direction at 200 μm/s; n = 6. For both On and Off responses, the cholinergic excitation had more nonlinear gain than the glutamatergic excitation. The integrated conductances were normalized and fit with the Hill equation (see materials and methods).

