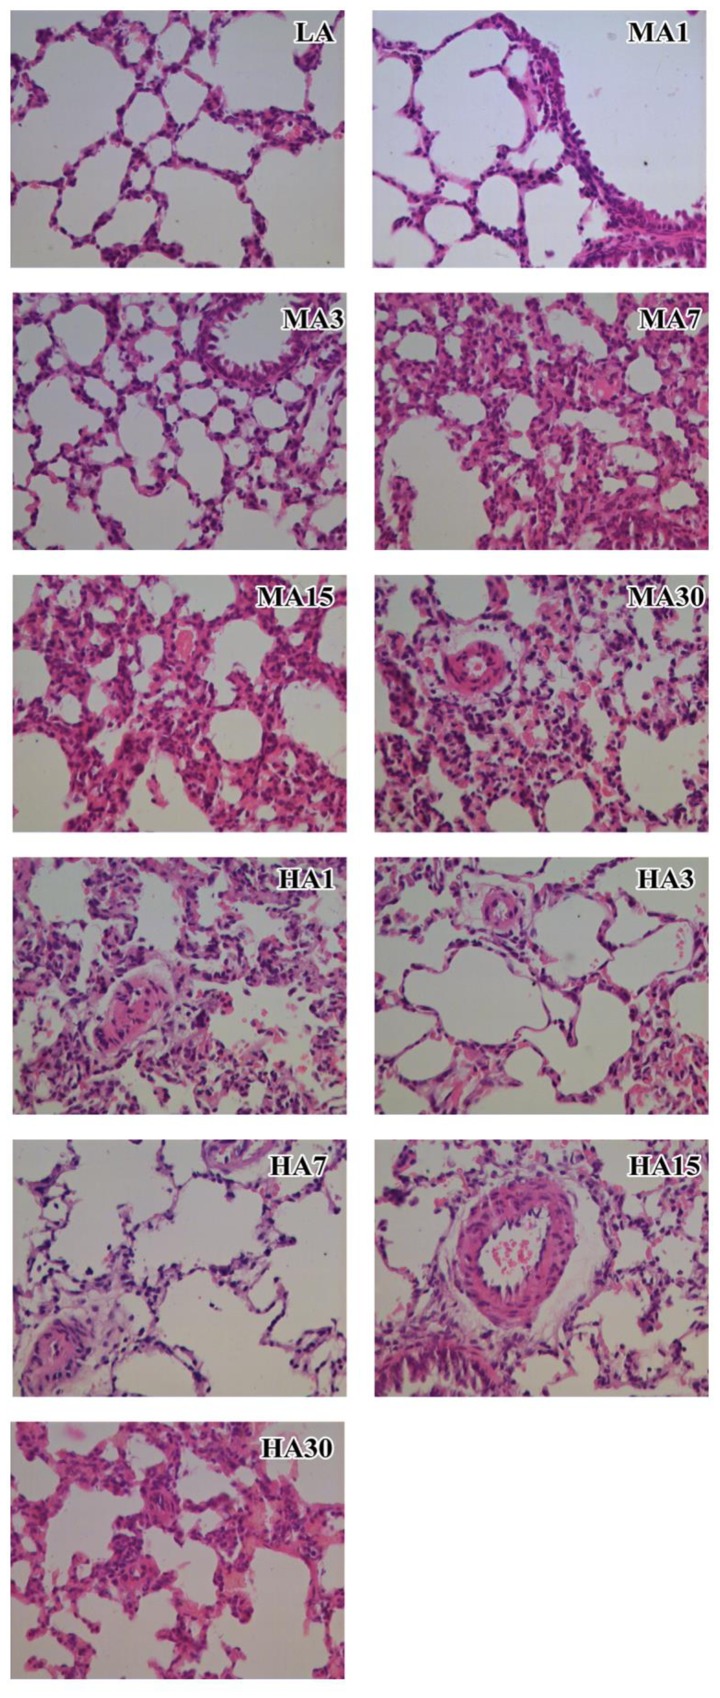
Figure 1.
Images of the pathological observation of the lung tissues of the rats in the different groups (magnification, x40). See text for a detail description of the results in each group. LA, low altitude; HA, MA, middle altitude; HA, high altitude; MA and HA1, 2, 7, 15, 30 represent the MA and HA subgroups at 1, 3, 7, 15 and 30 days, respectively.

