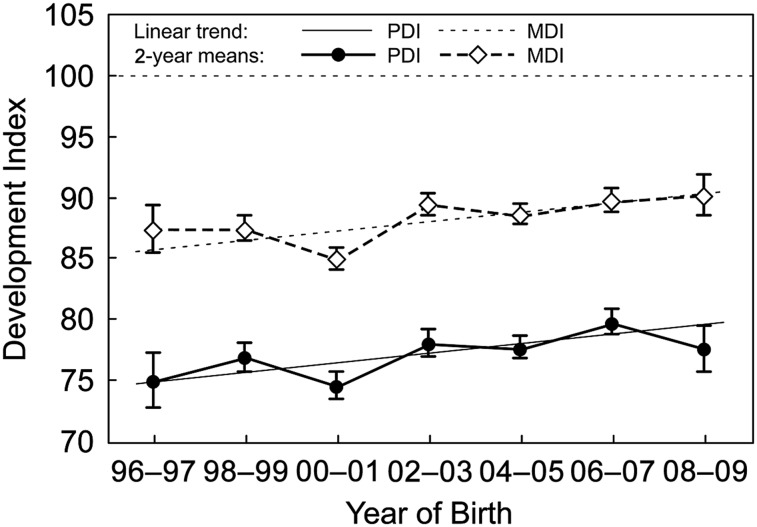
FIGURE 2.
Standardized PDI and MDI means by year of birth. The standardized means plot the predicted PDIs and MDIs and SE bars based on a model with year of birth category adjusting for center, cardiac class, and other statistically significant predictors at the mean value of the covariates. Overlaid are standardized means plots based on continuous year of birth. The horizontal dotted line represents the normative mean of 100 for both PDI and MDI.

