
FIGURE 3.
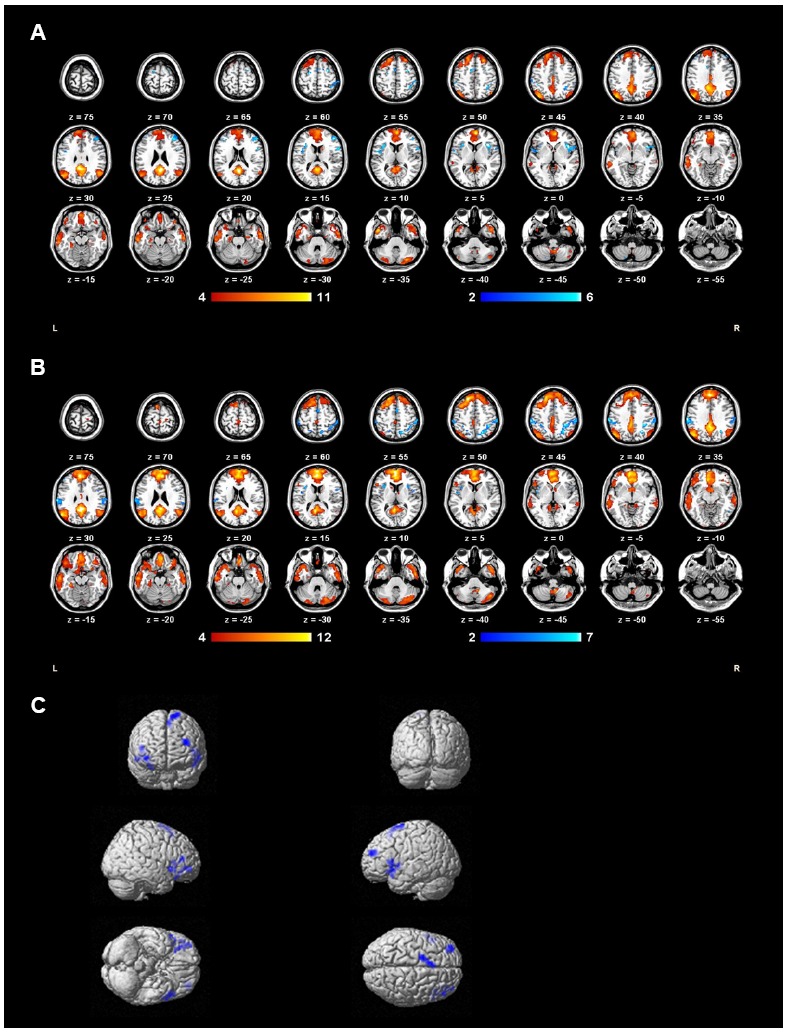
Group DMN extracted by ICA of MDD group (A) and control group (B) subjects. (C) DMN regions with decreased functional connectivity in the MDD group compared to controls during the gender judgment task are shown in blue.
Official websites use .gov
A
.gov website belongs to an official
government organization in the United States.
Secure .gov websites use HTTPS
A lock (
) or https:// means you've safely
connected to the .gov website. Share sensitive
information only on official, secure websites.
Group DMN extracted by ICA of MDD group (A) and control group (B) subjects. (C) DMN regions with decreased functional connectivity in the MDD group compared to controls during the gender judgment task are shown in blue.