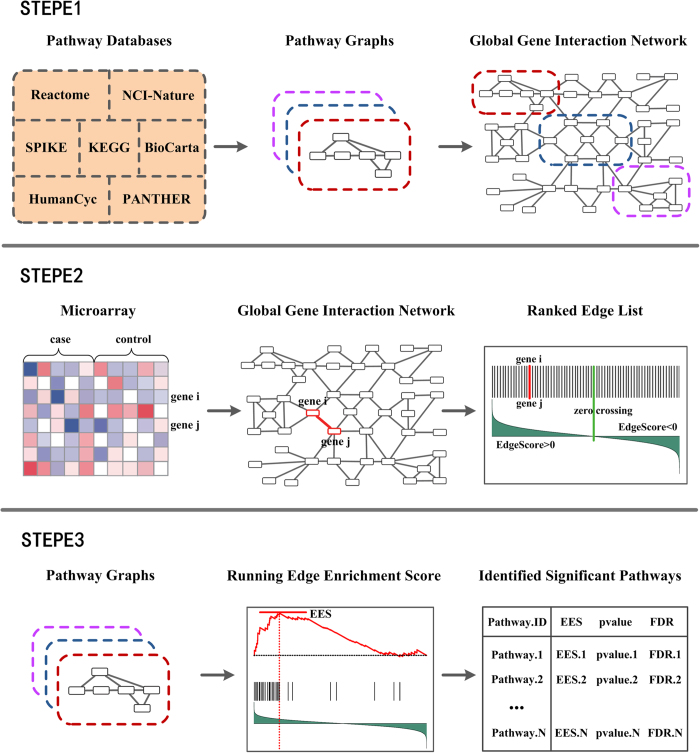
Figure 1. Flow diagram of the methodology.
Step 1. Pathways in the seven pathway databases are converted to the corresponding pathway graphs. These pathway graphs are merged into a global gene interaction network, and all the edges in the global network are used as the background set of edges. Step 2. Gene expression data is mapped to the edges in the global network. The differential correlation score for each edge (EdgeScore) are estimated, and a ranked edge list is formed according to the EdgeScore. Step 3. Edges in a given pathway are mapped to the ranked edge list, and the edge enrichment score of pathway is calculated by walking down the list. The pathways are prioritized by FDR after permutation test.

