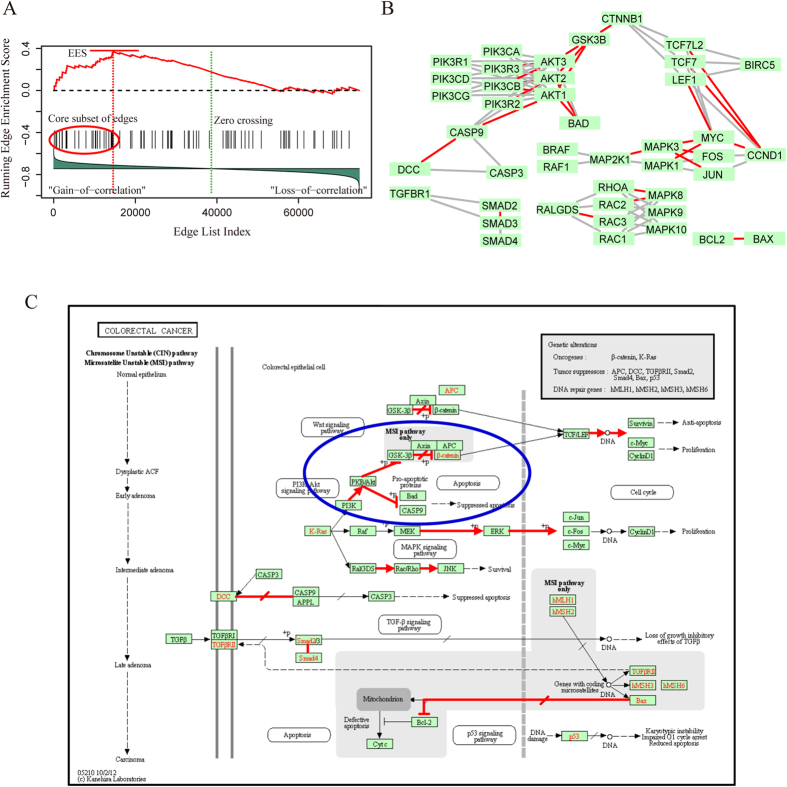
Figure 3. Running enrichment score and annotating core subset of edges to the colorectal cancer pathway.
(A) Running-sum statistic is calculated by walking down the edge list, and the maximum deviation from zero of the statistic is used as edge enrichment score of the pathway. (B) Core subset of edges are extracted and mapped to the pathway graph. (C) Colorectal cancer pathway in KEGG, and the biological relationships which correspond to the core edges are annotated with red.

