
Table 4.
The difference between left and right side of the subaxial pedicles (2)
PTA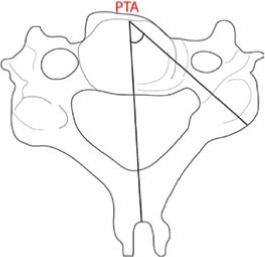
|
PSA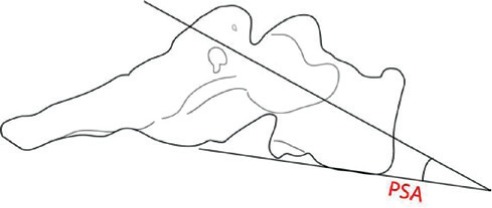
|
|||||
|---|---|---|---|---|---|---|
| Left | Right | P value | Left | Right | P value | |
| C3 | 46.13° ± 3.74° | 46.60° ± 3.11° | 0.5315 | 14.13° ± 1.67° | 13.56° ± 2.03° | 0.2814 |
| C4 | 48.16° ± 1.66° | 48.89° ± 3.85° | 0.4365 | 7.27° ± 1.56° | 6.92° ± 1.25° | 0.2647 |
| C5 | 49.29° ± 3.14° | 48.50° ± 3.51° | 0.2805 | 2.38° ± 1.19° | 3.04° ± 1.48° | 0.0364* |
| C6 | 43.93° ± 3.74° | 44.68° ± 4.20° | 0.2727 | −4.73° ± 2.72° | −4.37° ± 2.06° | 0.2862 |
| C7 | 37.98° ± 4.77° | 39.60° ± 4.78° | 0.0058* | −6.73° ± 1.36° | −7.16° ± 1.69° | 0.2736 |
Values are the mean and standard deviation in degrees.
*
Statistically significant (P < 0.05). PSA: pedicle sagittal angle of the subaxial cervical spines vis-à-vis side, PTA: pedicle transverse angle.