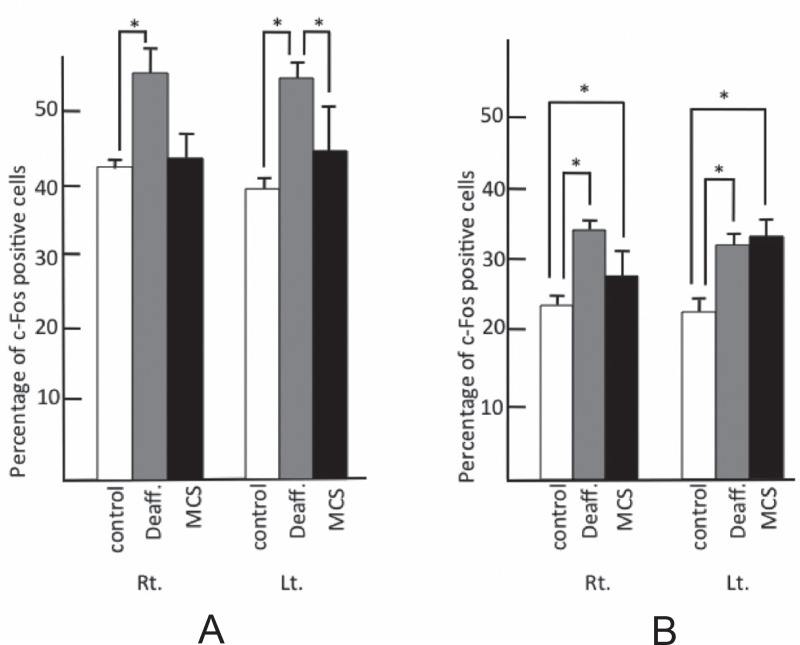
Fig. 6.
Percentage of c-Fos-positive cells in the descending analgesic system. A: pontine reticular formation, B: periaqueductal gray matter. Control: white bar shows control group, Deaff.: gray bar indicates deafferentation pain group, MCS: black bar shows motor cortex stimulation group. Each figure shows the median with quartile deviation (vertical bar). *p < 0.05 compared to control by the Mann-Whitney U test. Lt.: left, MCS: motor cortex stimulation, Rt.: right.

