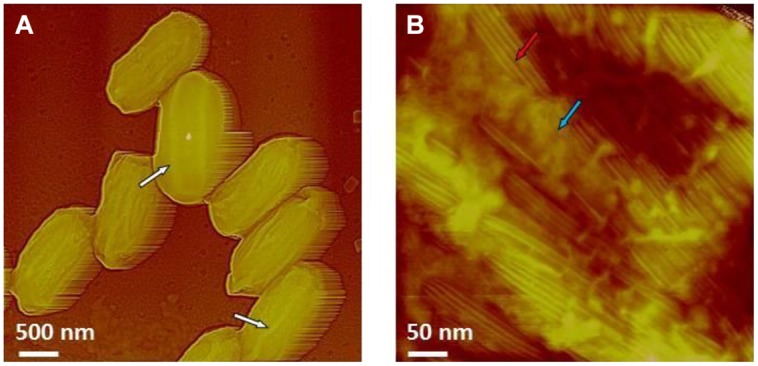
FIGURE 14.

(A,B) AFM images of B. atrophaeus spores exposed to a sterilization (6-log kill) dose of ClO2 (500 ppm × 5 h = 2500 ppm-h). In (A) surface ridges extending along the entire length of spores (several surface ridges noted by white arrows) are seen. In (B) high-resolution AFM image showing the regular rodlet structure (red arrow) and patches of an amorphous outermost layer (blue arrow), both characteristic to native, air dried B. atrophaeus spores.
