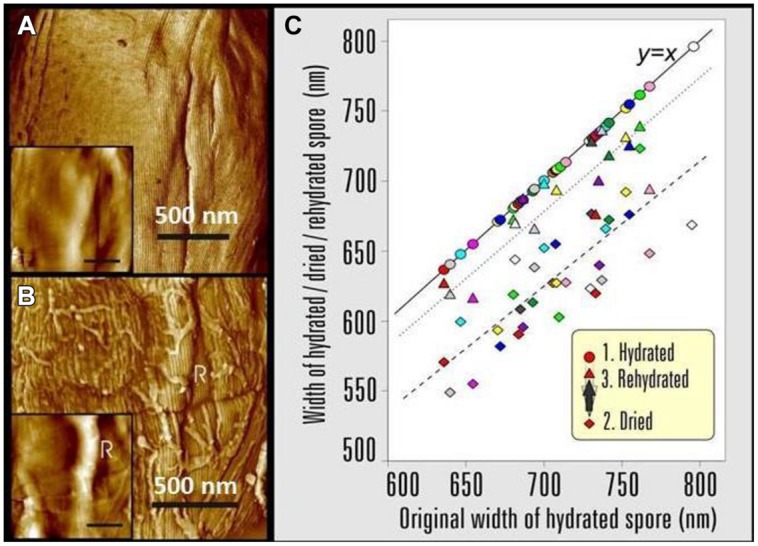
FIGURE 15.

AFM images showing the effects of changing the B.atrophaeus spore environment form hydrated to dehydrated states. (A) Phase image and height image (inset) detail of a B. atrophaeus spore in water, showing rodlet spore coat structure and several shallow wrinkles. (B) The same spore after drying, showing rodlet structure (with many adsorbed stray rodlets, which sedimented from the bulk solution upon drying of the sample) and a 60-nm high ridge (indicated with R). The graph (C) shows spore width variations of 35 individual B. atrophaeus spores, as a function of the size of the originally hydrated spore, followed by dehydration (24 h; diamonds, dashed trend line), then rehydration (2 h; triangles, dotted trend line). For ease of comparison, the original hydrated spore width is (redundantly) depicted as circles, which by definition lie on the solid y = x line. Thus, the three data points for one individual spore, depicted with the same color, are all on the same vertical line. Several spores detached from a substrate during rehydration experiments resulting in a smaller amount of experimental rehydration points (triangles). On average, spore size is reduced to 88% for dried spores, and returns to 97% of the original width for rehydrated spores. Images reproduced, with permission from Plomp et al. (2005a), Copyright © (2005). The Biophysical Society. Published by Elsevier, Inc.
