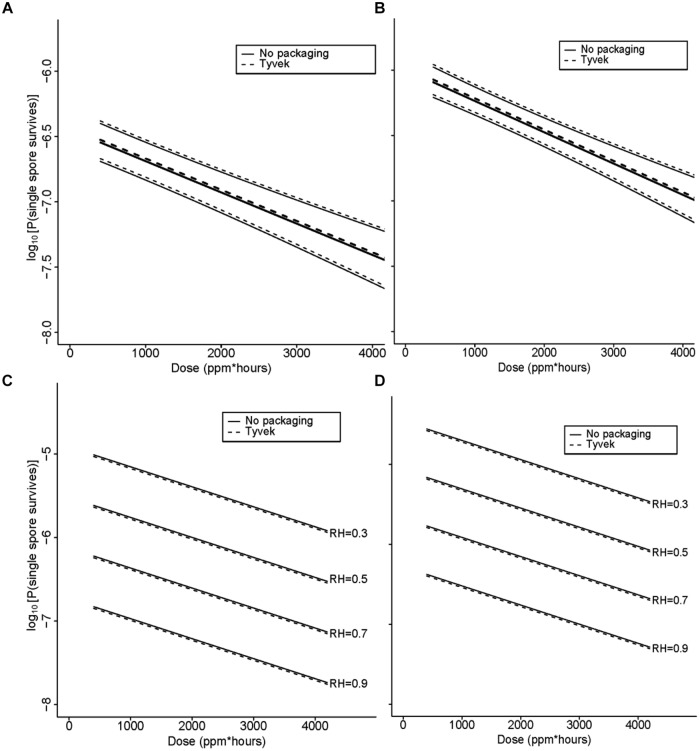
FIGURE 6.
(A) Statistical modeling showing the probability, with 95% confidence, of a single B. atrophaeus spore, with a DEtO value of 3.1 and fixed strip inoculum of 106, in Tyvek (n = 38) and no packaging (n = 36), surviving a ClO2 dose range of 110–199 ppm-h at 79% RH. In the figures (A–D), the lighter set of dashed and solid lines represent the confidence interval for spore strips packaged in Tyvek or no packaging, respectively, while the middle bold lines represent the predicted probabilities. (B) Statistical modeling showing the probability, with 95% confidence, of a single B. atrophaeus spore, with a DEtO value of 5.0 and fixed strip inoculum of 106, in Tyvek (n = 98) and no packaging (n = 70), surviving a ClO2 dose range of 110–1991 ppm-h at 79% RH. (C) Predicted probabilities for a single B. atrophaeus spore, with a DEtO value of 3.3 and fixed strip inoculum of 1.3 × 10⁶, in Tyvek (n = 500, dashed line) or no packaging (n = 500, solid line). (D) A DEtO value of 3.8 and fixed strip inoculum of 1.3 × 10⁶, in Tyvek (n = 498, dashed line) or no packaging (n = 498, solid line), surviving a range of ClO2 doses with RH varying from 30 to 90%. The results of this fitted model, which has an offset term of log(N; fixed in this example) shows again that dose has a similarly strong effect as previously in that increasing it decreases the probability of spores surviving on a strip (p < 0.01). There is no evidence of an effect of packaging (p = 0.73), and there is strong evidence of an increase in survival probability with increasing DEtO values (p < 0.01) and with decreasing RH (p < 0.01). The DEtO variable was treated as a categorical variable to be consistent with earlier models and so the regression coefficient compares DEtO = 3.3 to DEtO = 3.8.

