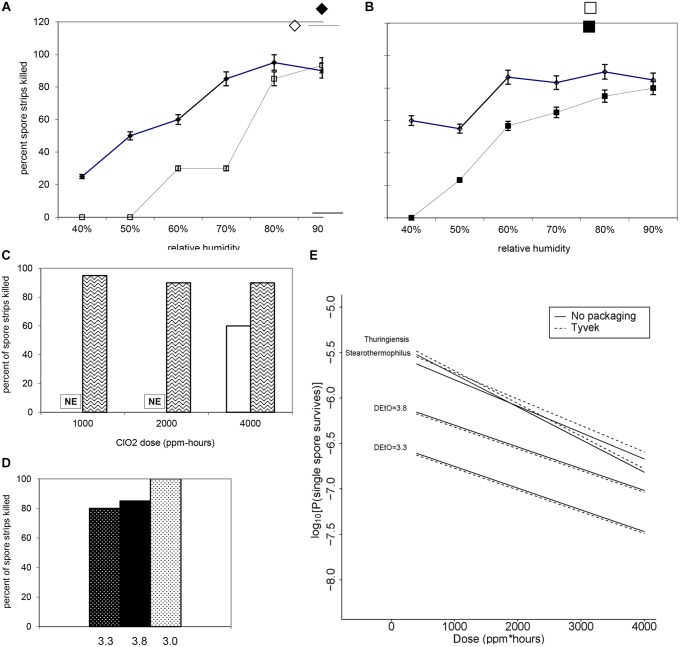
FIGURE 7.
Increasing RH at a fixed dose of (A) 500 ppm ClO2 for 4 h (∼2000 ppm-h) and (B) 1000 ppm ClO2 for 4 h (∼4000 ppm-h) results in a higher percentage of log 6 B. atrophaeus spore strips being killed. (A) B. atrophaeus DEtO = 3.3 (n = 120), = B. atrophaeus DEtO = 3.8 (n = 160); (B) B. atrophaeus DEtO = 3.3 (n = 140), and B. atrophaeus DEtO = 3.8 (n = 140). Data shown is for spore strips packaged in Tyvek. For the DEtO = 3.3 strips exposed to ∼2000 ppm-h ClO2, ≥80% kill is achieved at 70 %RH and above, but when we increase the dose to ∼4000 ppm-h the same level of kill is achieved at %RH of 60. The relationship between low DEtO value and increased susceptibility to ClO2 is evident, though, in this example, we see that at 90 %RH all four sample sets are behaving roughly the same. (C) B. atrophaeus DEtO = 3.3, log 6 spore strips packaged in img medical-grade glassine, and img Tyvek are not equally susceptible to a set ClO2 dose at 79 %RH (NE = no effect). Spore strips were exposed to 250 ppm ClO2 for 4 h (dose ≈1000 ppm-h), where n = 20 each for glassine and Tyvek; 2000 ppm-h, where n = 40 (glassine) and n = 20 (Tyvek); and 4000 ppm-h, where n = 40 (glassine) and n = 20 (Tyvek) at constant temperature and %RH. (D) We did not achieve 100% kill for glassine-packaged log 6 spore strips until we subjected a lot of B. atrophaeus with DEtO value of 3.0 (n = 20) to 2000 ppm for 10 h (∼20,000 ppm-h) at 79 %RH. This high dose killed 80 and 85% of B. atrophaeus DEtO = 3.3 and 3.8 (n = 20 each) spore strips, respectively. (E) For all three species and B. atrophaeus with two different DEtO values (3.3, with n = 80 for each Tyvek and no packaging; and 3.8, with n = 189 for each Tyvek and no packaging), probabilities were predicted for a spore surviving after treatment, with RH = 0.79 and N = 106. Note that for B. thuringiensis (n = 98 each for Tyvek and no packaging), measurements were only made at N = 1.2 × 10⁶. For both sets of B. atrophaeus, measurements were made at N = 1.3 × 10⁶, so in these cases this plot involves extrapolation in N. B. thuringiensis, the closest phylogenetic relative to Bacillus anthracis used in this study, is more likely to survive at any given ClO2 dose than either of the B. atrophaeus strains, though it’s resistance is similar to the strain of G. stearothermophilus (n = 80 each for Tyvek and no packaging) assayed.

