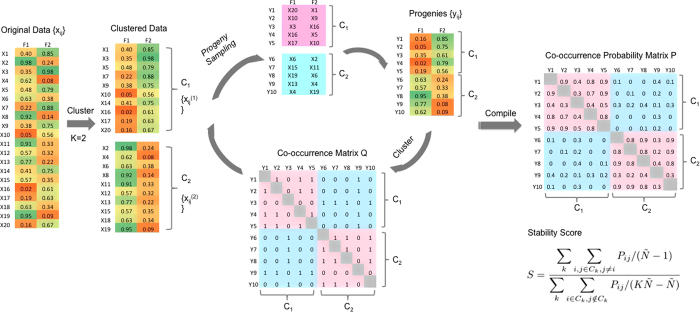
Figure 1. An illustration of the core steps in Progeny Clustering. The dataset in the example consists of 20 samples (denoted as X) in a two-dimensional space (denoted as F1 and F2).
The scheme displays the workflow of generating a stability score for clustering this dataset into two clusters. Five progenies (denoted as Y) were generated for each cluster. The co-occurence matrix Q represents one of the clustering results of the mixed progenies, in which matrix entries are 1 if two progenies are in the same cluster and 0 otherwise. In both co-occurrence matrices Q and P, the true classification region containing progenies from the same initial cluster is colored pink and the false classification region containing progenies from different initial clusters is colored light blue. If the clustering quality is high, we would expect more 1 s (Q) or higher probabilities (P) in the true classification region and more 0 s (Q) or lower probabilities (P) in the false classification region.

