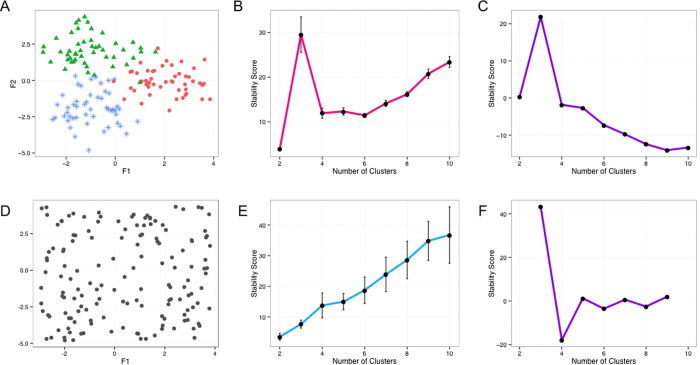
Figure 2. An illustrative example of applying Progeny Clustering to a three-cluster two-dimensional toy dataset:
(A) a scatterplot of the original dataset showing its three-cluster structure; (B) the stability score curve of the original dataset illustrating the clustering quality of the data from 2 clusters through 10 clusters; (C) the stability curve generated by Equation (4) based on the “greatest score” criterion suggesting three as the optimal cluster number; (D) a scatterplot of an example reference dataset showing lack of cluster structure; (E) the stability score curve of the reference datasets showing that the clustering stability linearly increases with an increase in cluster number; (E) the stability curve generated by Equation (4) based on the “greatest score” criterion suggesting three as the optimal cluster number; (F) the stability curve generated by Equation (7) based on the “greatest gap” criterion suggesting three as the optimal cluster number.

