Figure 4.

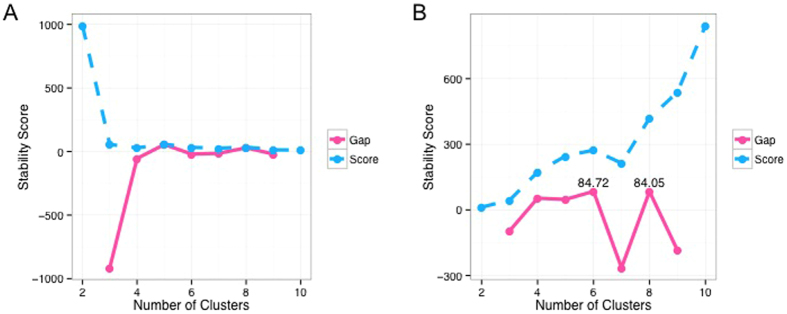
The Progeny Clustering results for the (A) Iris dataset and (B) Rat CNS dataset. Curves from both criteria were shown, indicating two or five clusters in (A) and six or ten clusters in (B).

The Progeny Clustering results for the (A) Iris dataset and (B) Rat CNS dataset. Curves from both criteria were shown, indicating two or five clusters in (A) and six or ten clusters in (B).