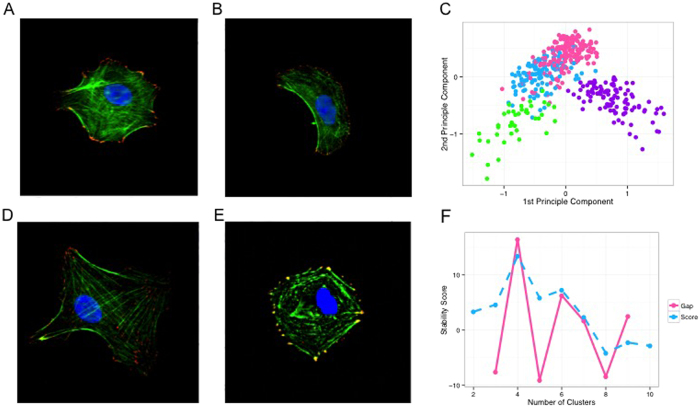
Figure 5. Images of four main categories of cell phenotypes:
(A) star-shaped (B) crescent-shaped; (D) Texas-shaped; (E) square-shaped. In each of these images, cells were fluorescently immunolabeled for the cytoskeletal proteins vinculin and actin, and stained by DAPI for nuclei. Image analysis results: (C) a scatterplot of the four cell categories in the space of the first two principle components, in which each dot represents a cell and the dot’s color indicates its cell type. This shows that the features we used to characterize the cell phenotypes are able to distinguish the four categories. (F) Progeny Clustering curves indicating four as the optimal number for clustering.

