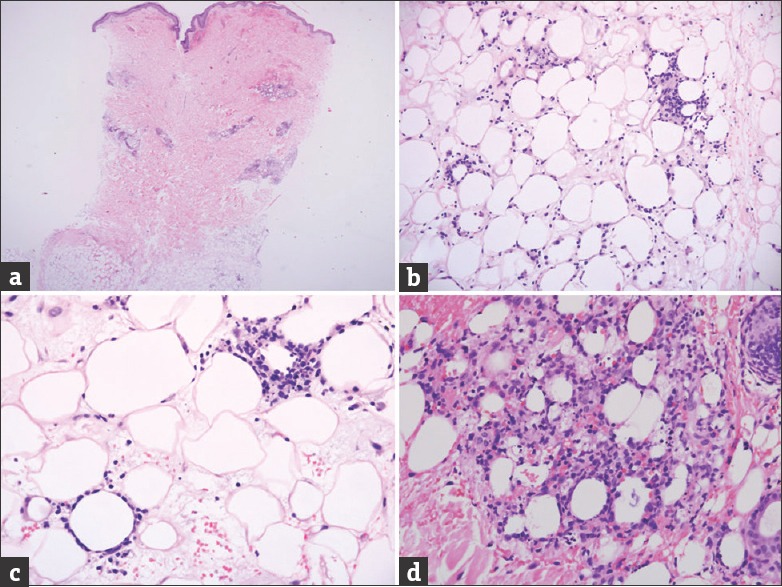
Figure 2.

(a) Low power view of the skin biopsy shows perivascular and subcutaneous fat cellular infiltrate. (b) Medium power view of the subcutaneous fat shows a lobular lymphocytic infiltrate. (c) High power view shows that the lesional lymphocytes rim the adipocytes. Some nuclear dust is noted. (d) Another high power view shows marked lesional lymphocytic and histiocytic infiltrate amongst the adipocytes with nuclear dust. (Hematoxylin and Eosin, original magnification, A: ×20, B: ×100 and C and D: ×200)
