Table 1. Ca2+ release via IP3R evoked by triazolophostins a .
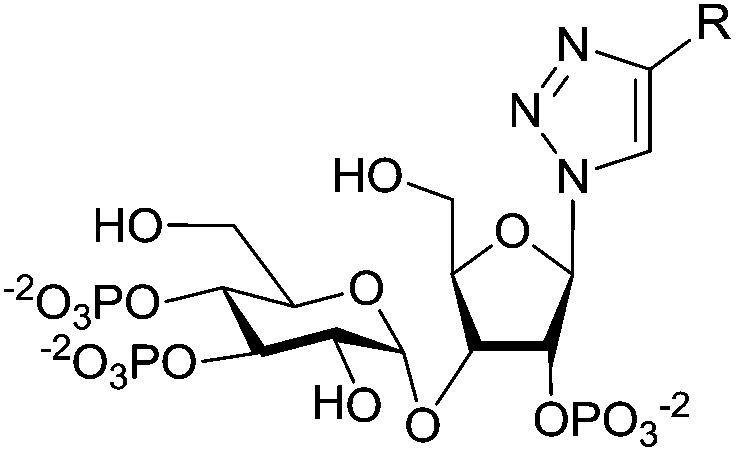
| |||||
| Ligand | R = | pEC50 | EC50 (nM) | EC50 w.r.t. 1 | Max. response (%) |
| IP3 (1) | 6.75 ± 0.08 | 178 | 1 | 73 ± 3 | |
| AdA (2) | 8.05 ± 0.04 | 9 | 20 | 73 ± 2 | |
| 10a | H | 7.87 ± 0.00 | 13 | 13 | 71 ± 1 |
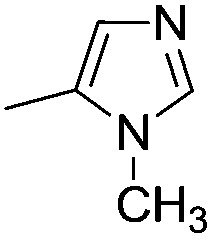
| 10b |
|
7.75 ± 0.03 | 18 | 10 | 72 ± 2 |
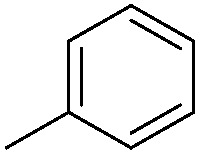
| 10c |
|
7.81 ± 0.05 | 15 | 11 | 65 ± 3 |
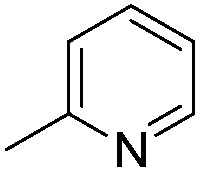
| 10d |
|
7.77 ± 0.03 | 17 | 10 | 64 ± 1 |
| 10e |
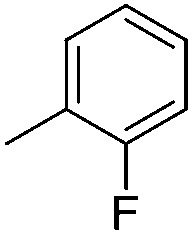
|
7.70 ± 0.07 | 20 | 9 | 75 ± 4 |
| 10f |
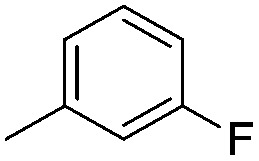
|
8.00 ± 0.03 | 10 | 18 | 69 ± 1 |
| 10g |
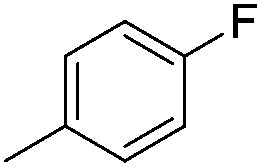
|
7.86 ± 0.04 | 14 | 13 | 71 ± 2 |
| 10h |
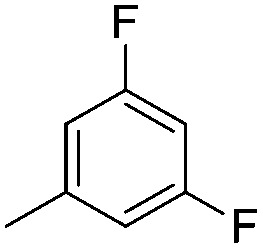
|
7.64 ± 0.01 | 23 | 8 | 67 ± 2 |
| 10i |
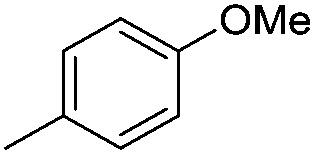
|
7.45 ± 0.03 | 35 | 5 | 65 ± 1 |
| 10j |
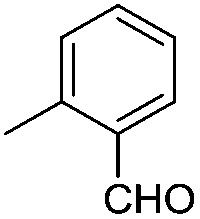
|
7.78 ± 0.03 | 17 | 11 | 68 ± 2 |
| 10k |
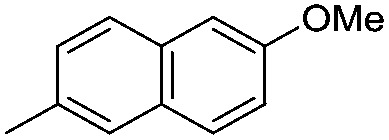
|
7.89 ± 0.02 | 13 | 14 | 70 ± 1 |
aResults show the maximal Ca2+ release (% of Ca2+ content of intracellular stores), EC50 and pEC50 values (means ± SEM from at least 3 experiments), and EC50 relative to 1 (ECIP350/ECanalog50). Hill coefficients were not significantly different from 1.
