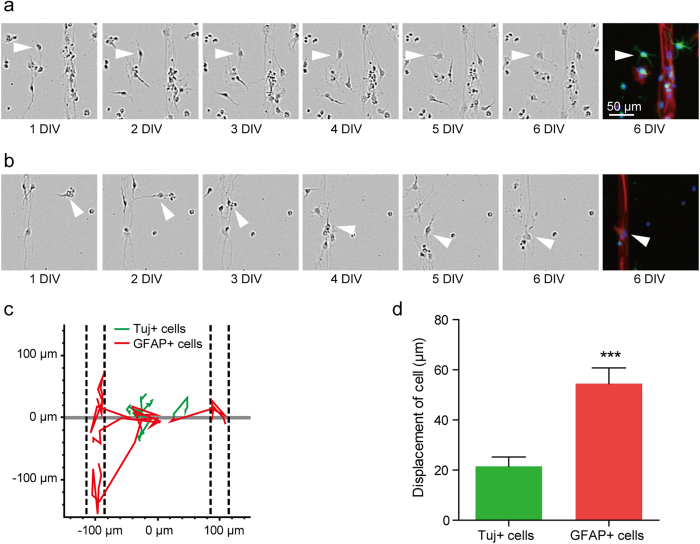
Figure 5. Tracking aNSCs, which were placed on PDL background initially for 6 days.
(a) Phase-contrast micrographs of Tuj-1 positive cell at 1 to 6 DIV and fluorescence micrographs of Tuj-1 positive cell at 6 DIV. (b) Phase-contrast micrographs of GFAP positive cell at 1 to 6 DIV and fluorescence micrographs of GFAP positive cell at 6 DIV. The white arrowhead indicates the target cell. (c) Traces of 5 Tuj-1 positive cells (green) and 5 GFAP positive cells (red) on the substrate. The dashed lines mean the location of LN stripes. (d) Average displacement (mean ± S.E., n = 22 and 20 for Tuj-1 positive cells and GFAP positive cells, respectively) of the Tuj-1 positive cells and GFAP positive cells for 6 days. (***p < 0.001).

