
Figure 3.
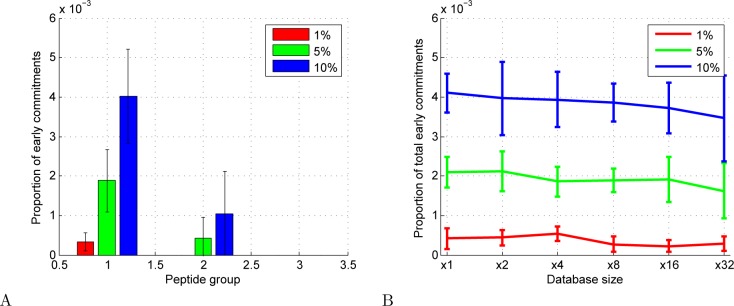
Early commitments in simulation. (A) The proportion of early commitments, as defined in the text, in the simulation described in Section 3.1. (B) The proportion of early commitments in the total set of accepted PSMs, plotted as a function of the size of the peptide database. In both panels, values are means and error bars represent standard deviation across 10 simulations.