
Figure 2.
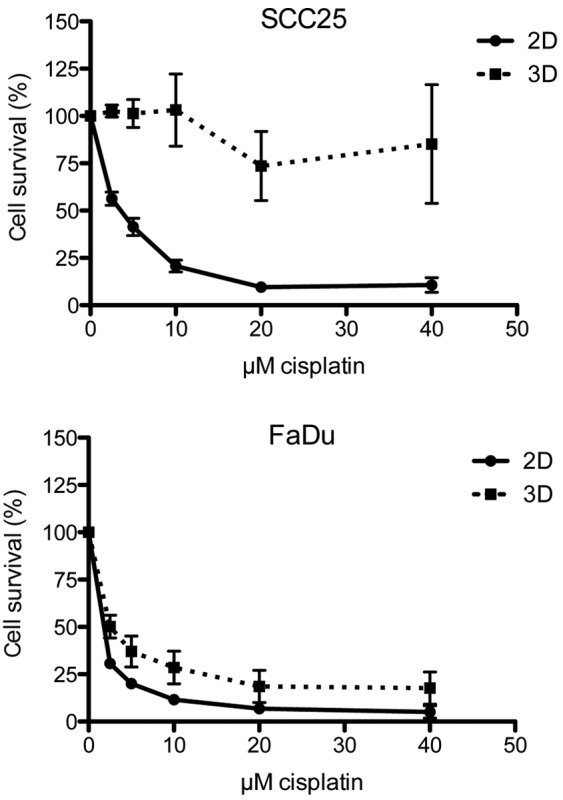
Dose-response curves of head and neck squamous cell carcinoma SCC25 and FaDu cell lines in the presence of increasing doses of cisplatin after 72 h of incubation. All experiments were performed in triplicate and repeated three times, and the data are presented as the mean and standard error of the mean. 2D, two-dimensional; 3D, three-dimensional.