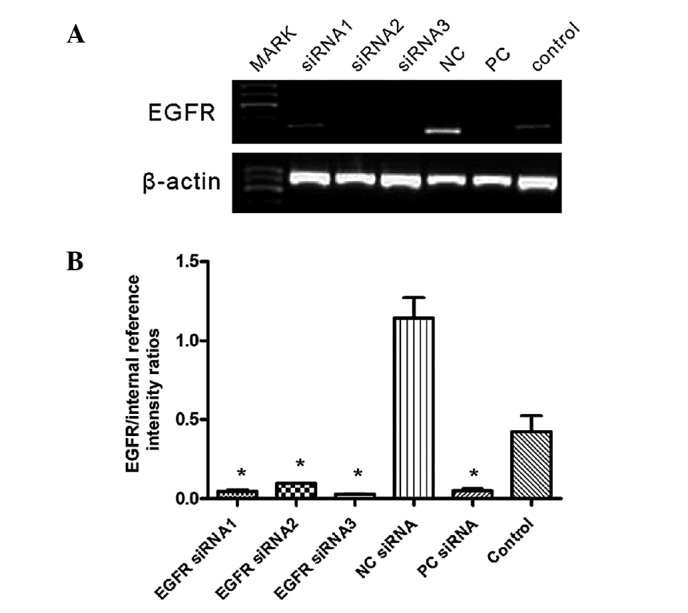
Figure 2.

EGFR-siRNA transfection reduces EGFR mRNA expression levels. (A) Reverse transcription-PCR was used to detect the EGFR and β-actin gene expression in the various groups 48 h following transfection. (B) PCR products were semi-quantified by assessing the relative intensity of messenger RNA expression using image analysis by comparing EGFR with β-actin. Data are presented as the mean ± standard deviation of three independent experiments (*P<0.0001 vs. Control). EGFR, epidermal growth factor receptor; siRNA, small interfering RNA; PCR, polymerase chain reaction; NC, non-targeting siRNA (negative control); PC, postitive interference siRNA (positive control); Control, blank control group (untransfected).
