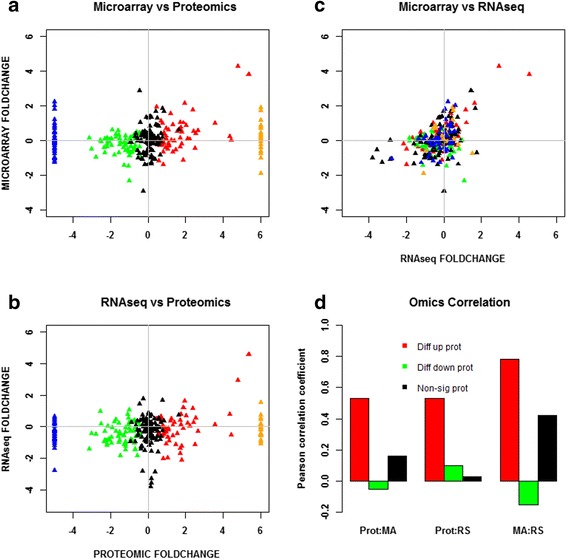
Fig. 4.

Comparison and correlation between proteomic and transcriptomic data under high butanol stress. a Microarray versus proteomic comparison. b RNAseq versus proteomic comparison. c Microarray versus RNAseq comparison. d Pearson correlation. All significant expressions are with respect to proteomic data only. Red: differentially upregulated proteins; green: differentially downregulated proteins; black: non-significant proteins; blue: proteins expressed only under non-stress control; orange: proteins expressed only under stress
